Multipad graphics

Dear all,

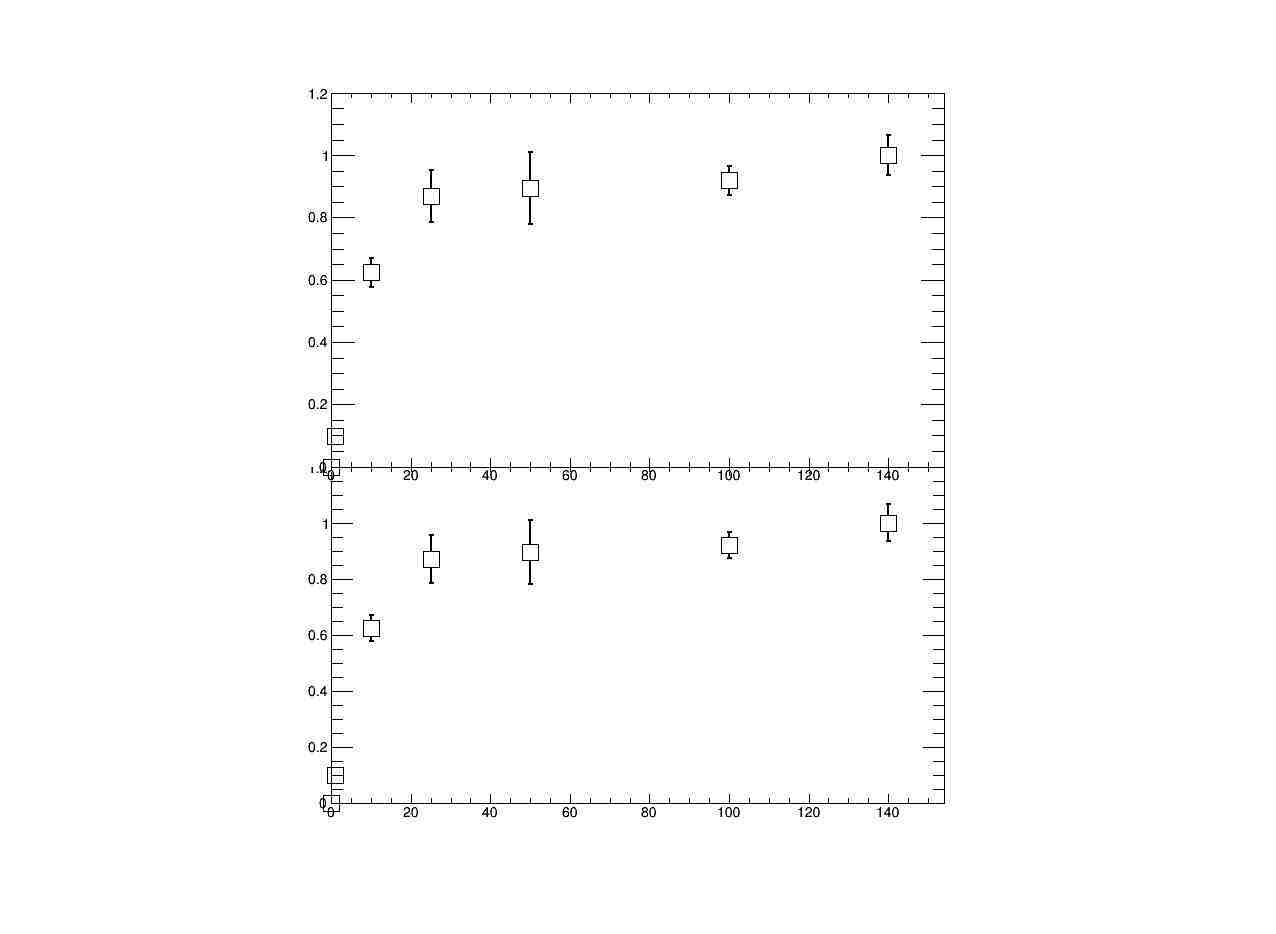
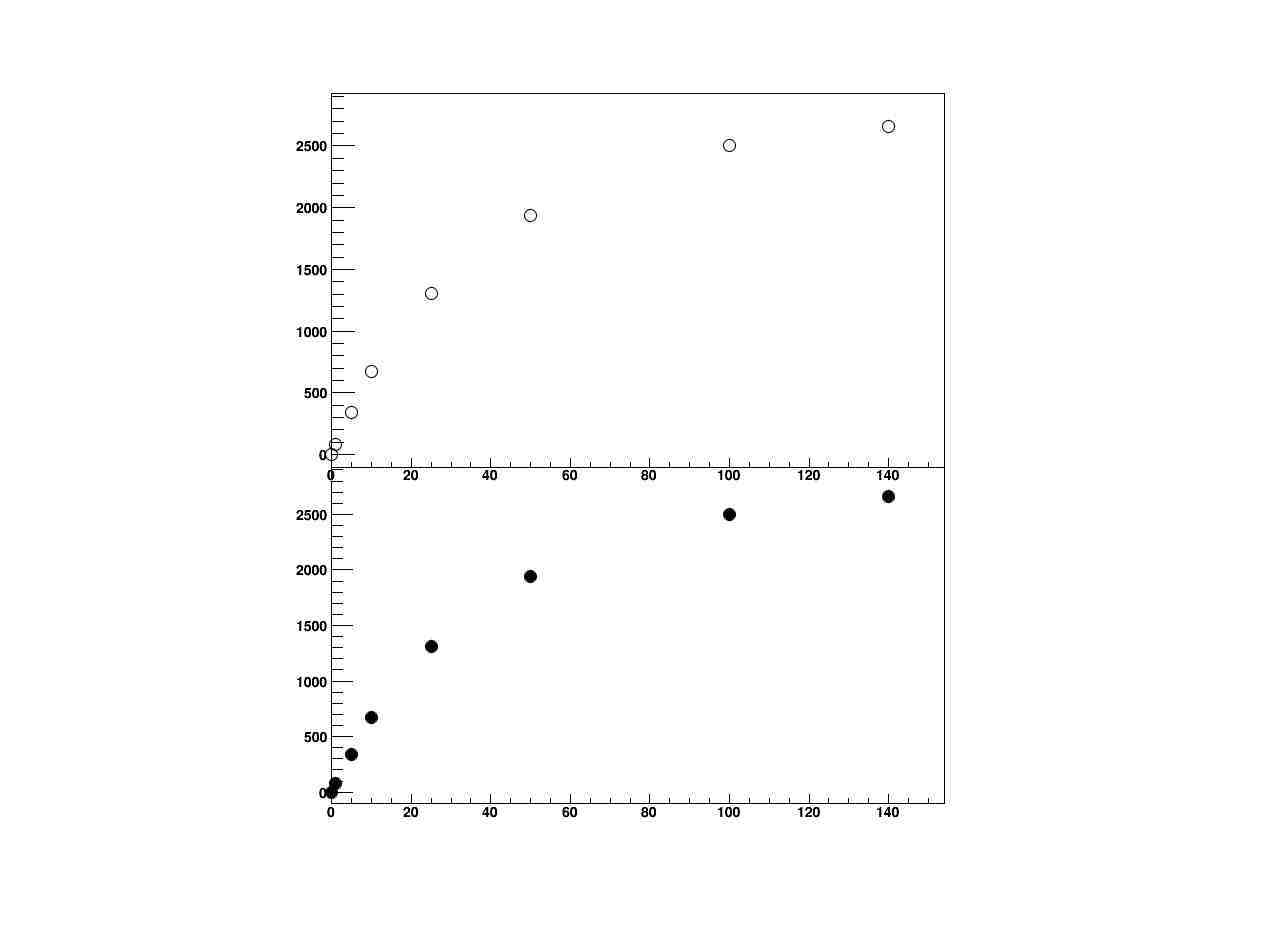
I write to ask suggestions concerning the graphics of a multipad. Basically, what I would like to have is two vertical pads, attached to each other. This is what I get, but as you can see from the attached figure, there are some issues concerning the axis labels. For instance, I would like to have the X label only on the lower plot, while there is some overlap between the labels on the Y axis.


Could you give some suggestions?

Thank you!

Best regards

1 Like

Yes I can :slight_smile:
But the best is to send me the small macro you made to produce this plot and I’ll modify it for you.

${ROOTSYS}/tutorials/graphs/zones.C
${ROOTSYS}/tutorials/graphics/canvas2.C

Formatting axis labels and more on a multi-pad canvas
How to draw more than two histograms with adjacent axises
Drawing several histograms with Divide()

Axis labels overlapped by pad
Ratio plot
Two Histograms Sharing Same X-Axis
Removing only X axis from a histogram?
Two adjacent Graphs

Thanks for the macro you sent me. As far as I see the only remaining issue is the overlapping labels on the Y axis.
It seems you manage to have the X axis labels only on the lower axis.
Right ?

void MultipadTest( ) { 

  gROOT->SetStyle("Plain");
  gStyle->SetOptStat(0);

  double DOSE[8] = {0., 1., 5., 10., 25., 50., 100., 140.};
  double DOM[8] = {0., 80., 338., 675., 1308., 1941., 2502., 2660.};
  
  
  TCanvas *c1 = new TCanvas("c1","multipads", 800, 700);
  gStyle->SetOptTitle(0);

  
  TPad *p1 = new TPad("p1", "p1", 0.2, 0.1, 0.8, 0.5, 0, 0, 0);
  p1->SetTopMargin(0);
  p1->Draw();
  
  TPad *p2 = new TPad("p2", "p2", 0.2, 0.5, 0.8, 0.9, 0, 0, 0);
  p2->SetTopMargin(0);
  p2->SetBottomMargin(0);
  p2->Draw();
  

  TGraph *gr = new TGraph(8, DOSE, DOM);
  gr -> SetMarkerStyle(20);
  gr -> SetMarkerSize(1.5);
  gr -> GetXaxis()->SetTitle("");   
  gr -> GetYaxis()->SetTitle("");   
  gr->SetMinimum(-100.); // Allow to make the 0 on Y axis higher
  
  p1->cd(); gr -> Draw("AP");
  p2->cd(); gr -> Draw("AP");

}
1 Like

Thank you, now it looks already much better. However, I still have one problem. I still get the label on the X axis of the upper plot. I would like to skip it, since it is identical to the lower one. How can I do this?


Thanks again!

You should set the label size to 0 for the upper plot:

   Graph_Upper->GetXaxis()->SetLabelSize(0);