I have got a macro which draws a number of two-dimensional histograms in a grid. In general it works more-or-less fine, there are however a few issues it would be great if you could comment upon:
After the histograms in question have been drawn, white gaps appear between some of them which I haven’t been able to get rid of. Any idea where these come from?
For some reason, the same value of size of axis labels and titles possesses different meaning for the first and the last column/row of histograms and for all the others. Is this a bug? If not, how can I force the same size on all of them?
In order to make labels on the horizontal axes not overlap I tried to make them vertical by calling hist->GetXaxis()->LabelsOption(“v”), however this results in the message “Warning in TAxis::Sort: Cannot sort. No labels” and no orientation change. Am I doing something wrong here?
More on messing around with axis labels. Instead of using vertical orientation I would rather reduce the number of labels printed on the screen. Is there a method for controlling this?
Axis labels again. How could I delete the final (top-/rightmost) labels from axes so that they don’t overlap with first (bottom-/leftmost) labels from their neighbour?
Last but not least, I would like to get a single colour palette for all the histograms on the canvas, stretched along the whole right side of the pads. Is there any sensible way of doing this? I tried simply using “colz” instead of “col” on one of the histograms but unfortunately this doesn’t seem to allow the palette to be stretched beyond the boundaries of that histogram’s pad.
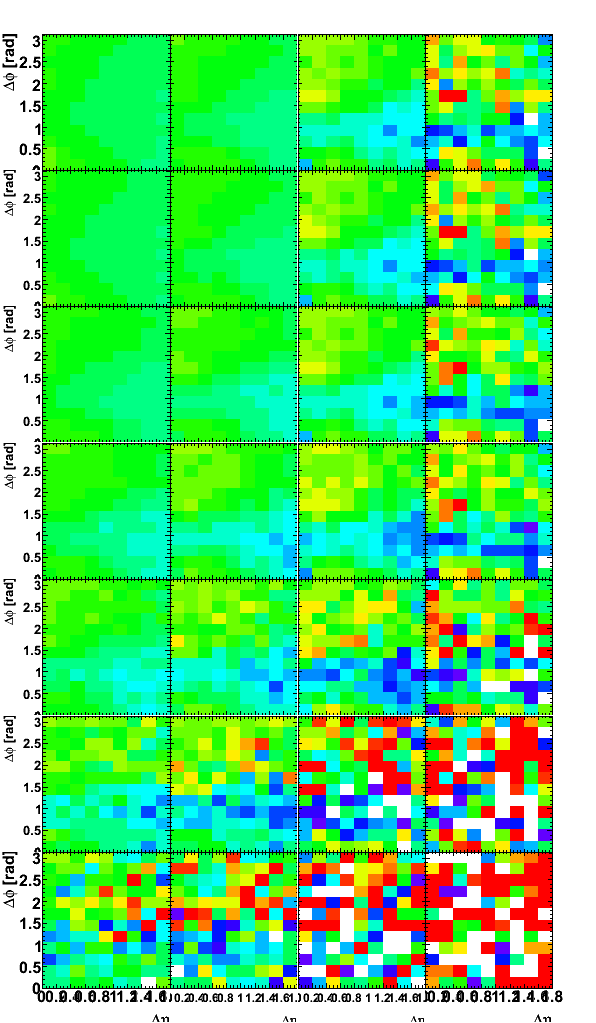
I use ROOT 5.18.00 and 5.20.00, on x86 and amd64. Attached you will find the macro files, the required input file and a screenshot of the output I get.
in makePadsHists.C . It makes it better, other wise it seems to me that that some precision issue. When I save a PS file there is no gap.
You should use pixel font size for labels and title. The text size is by default a % of the pad size. As the pads do not have the same sizes you get different text sizes. root.cern.ch/root/html/TAttText.html#T4
The palette is drawn in the pad and cannot exit it. To have a big palette you should create a new pad and draw the palette in it. I found a example which may give you ideas:
{
   TH2D* h = new TH2D("h", "Example Histo", 20,-1,1,20,-1,1);
   h->FillRandom("gaus", 1E6);
   h->Draw("COLZ");
   gPad->Update();
   TPaletteAxis* zaxis = (TPaletteAxis*)h->GetListOfFunctions()->FindObject("palette")->Clone("MyPalette");
   delete c1;
   delete h;

   TCanvas* pc = new TCanvas("pc", "PaletteCanvas", 50,500);

   pc->cd();
   zaxis->SetX1NDC(0.);
   zaxis->SetX2NDC(1.);
   zaxis->SetY1NDC(0.);
   zaxis->SetY2NDC(1.);
   zaxis->Draw();
   gPad->Modified();
   gPad->Update();
}
I am struggling with the text formatting in a multi-pad canvas as well.
Here is my macro: testCanvasPartition.C (4.48 KB)
I know that label and title sizes are expressed in percentage of the pad size.
The macro is intended to account for that and produce the same sizes and offset, etc. for every pad in the canvas.
However, it does not work properly and the text changes in size depending on the pad.
Please, would anybody help? I am in kind of a hurry.
Also, I think this is a common problem for many of my colleagues dealing with multi-pad canvases.
So what we learn here would be useful for others.
Divide() is not very clever and does not take into account the fact that the left column as wider left margins.
Some time ago I wrote the attached macro which takes that into account. div2.C (1.55 KB)
Hi! I am sorry, but I don’t understand your answer…
I am not using Divide(), but actually something rather similar to what you do in your macro.
Still in your example, tick lengths for instance are not equally sized.
The idea in my example is to resize everything taking into account the actual height and weight of each pad in a way that everything looks the same.
That shouldn’t be so difficult, but somehow it doesn’t work.
No, it doesn’t.
In your example there are no axis titles.
As soon as I set a title for the histogram the title sizes, and the offsets change in every canvas.
Also the ticks are not equally long in the pads in your original macro.
I upload here your macro with titles on axis: div2mod.C (1.76 KB)
ha yes … right… this macro was originally written to make sure the all the plots have the same size. Now it should be extended some how to make sure the labels have also the same size. AS the border pads do not have the same size as this inner ones some scaling should be apply. Give me time to investigate.
Exactly, now you got it.
The macro I have uploaded try to do this taking into account the size of every pad and “normalising” the labels, texts, ticks, etc. to get the same final sizes for every pad.
However it is not working properly, and I don’t understand why.
there is 3 sizes of pad (left right inner). Now I have looking at a way to get one as ref and compute the normalizing factor to be use in each SetSize for each pad… Not there yet.
Hello, I have found the solution to all these problems:
Fonts are defined with fix size (instead of in percentages of the pad size) using the font “precision 3” trick.
When this is done, the offsets are setup in pixel size too, and thus, do not depend on the pad size.
Last but not least, the tick sizes: These always will depend on the current pad because their sizes are always given as fractions of the canvas size. To compensate this effect, one needs to “normalize” the tick’s size to the actual height and width of the current pad.
Good ! I had some others matters to look at and therefore stop investigating. I will look again at your example and maybe add it in the standard examples (if you agree).