Maybe you want this:
int TEST() {
gROOT->SetStyle("Plain");
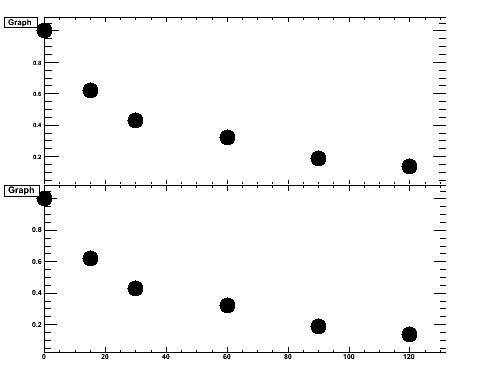
TCanvas *c1 = new TCanvas("c1","multipads",900,700);
c1->Divide(1,2,0,0);
gStyle->SetOptStat(0);
/* photons data after 45Gy */
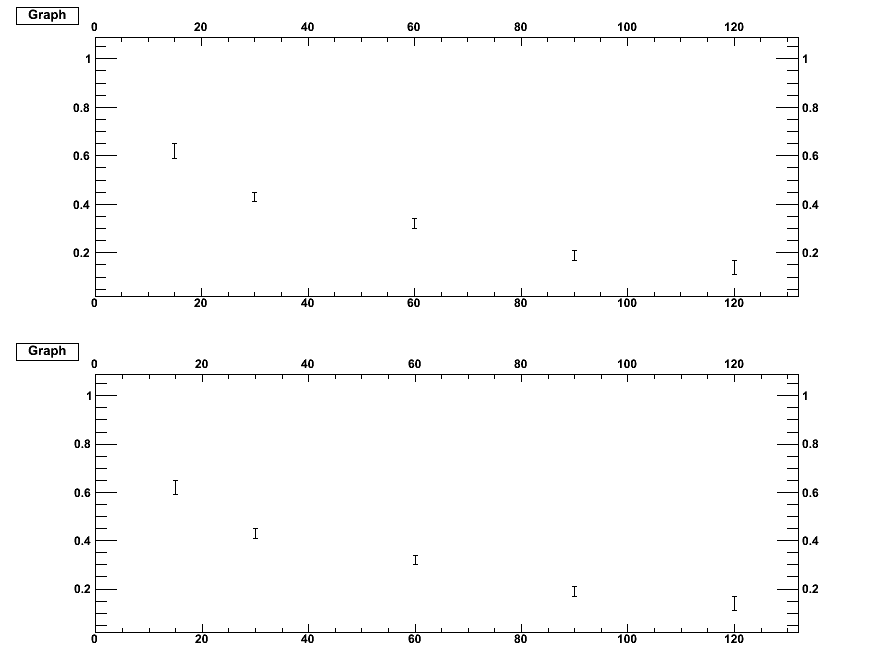
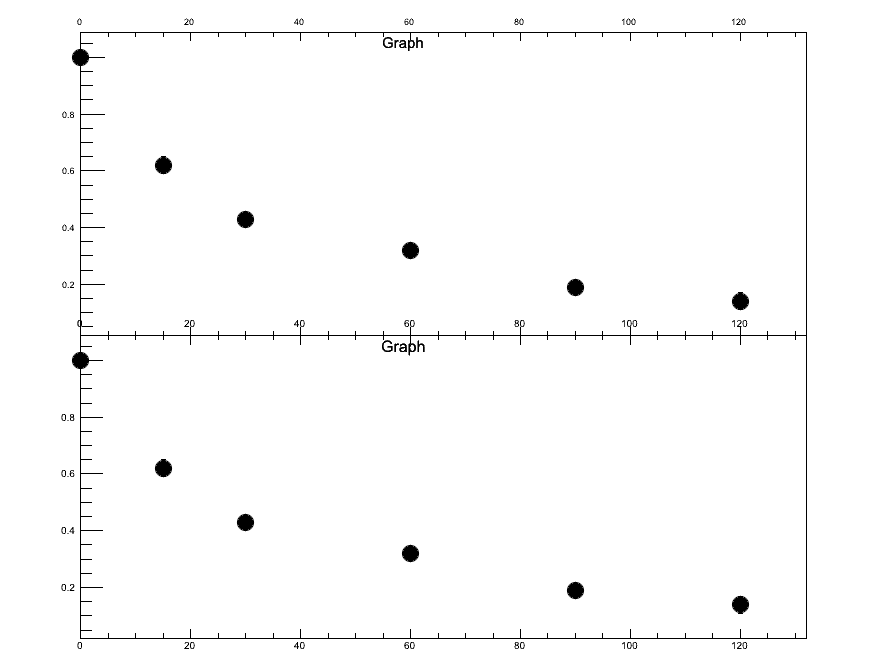
double time[6] = {0., 15., 30., 60., 90., 120.};
double data[6] = {1., 0.62, 0.43, 0.32, 0.19, 0.14};
double err[6] = {0., 0.65, 0.45, 0.34, 0.21, 0.17};
double ex[6] = {0.};
for(int ii=0; ii<6; ii++){
err[ii] = err[ii] - data[ii];
}
TGraphErrors *expBELLI = new TGraphErrors(6, time, data, ex, err);
c1->cd(1);
gPad->SetTickx(2);
gPad->SetTicky(2);
#if 0
TPad *pad_AAA = new TPad("pad_AAA","pad_AAA",0,0,1,1);
pad_AAA->SetTickx(2);
pad_AAA->Range(0.,0.05,200.0,1.0);
pad_AAA->Draw();
pad_AAA->cd();
#endif
expBELLI -> SetMarkerStyle(20);
expBELLI -> SetMarkerSize(2);
expBELLI->Draw("ap");
c1->cd(2);
gPad->SetTickx(2);
gPad->SetTicky(2);
#if 0
TPad *pad_BBB = new TPad("pad_BBB","pad_BBB",0,0,1,1);
pad_BBB->SetGrid();
pad_BBB->SetTickx(2);
pad_BBB->Range(0.,0.05,200.0,1.0);
pad_BBB->Draw();
pad_BBB->cd();
#endif
expBELLI->Draw("ap");
return 0;
}
BTW. On my screen, with ROOT 5.30, the most right vertical lines of the frames are not drawn. A clear bug somewhere - these lines are present in the “.ps” file.