Dear Experts,
I am working in the B Physics group.
In our analysis, we want to perform a study on “Feldman- Cousins of two POI methods”, for which I am not sure about the technical procedure.
Could you please point me to some reference or provide some skeleton code for the above method, so that I could start working on it?
Hi,
For doing a Feldman-Cousins in 2D you need to use the FeldmanCousins class. We have a tutorial example using it in 2D,
https://root.cern.ch/doc/master/rs401d__FeldmanCousins_8C.html
The problem is to find the right points to scan. Note that the FeldmanCousins has an interface to provide these points (FeldmanCousins::SetPoiPointsToTest, the difficult is to find these points close to the contour line.
Lorenzo
Dear @moneta,
I followed the tutorial code on the F-C 2D method (shared by you) and prepared a similar code relevant to my analysis.
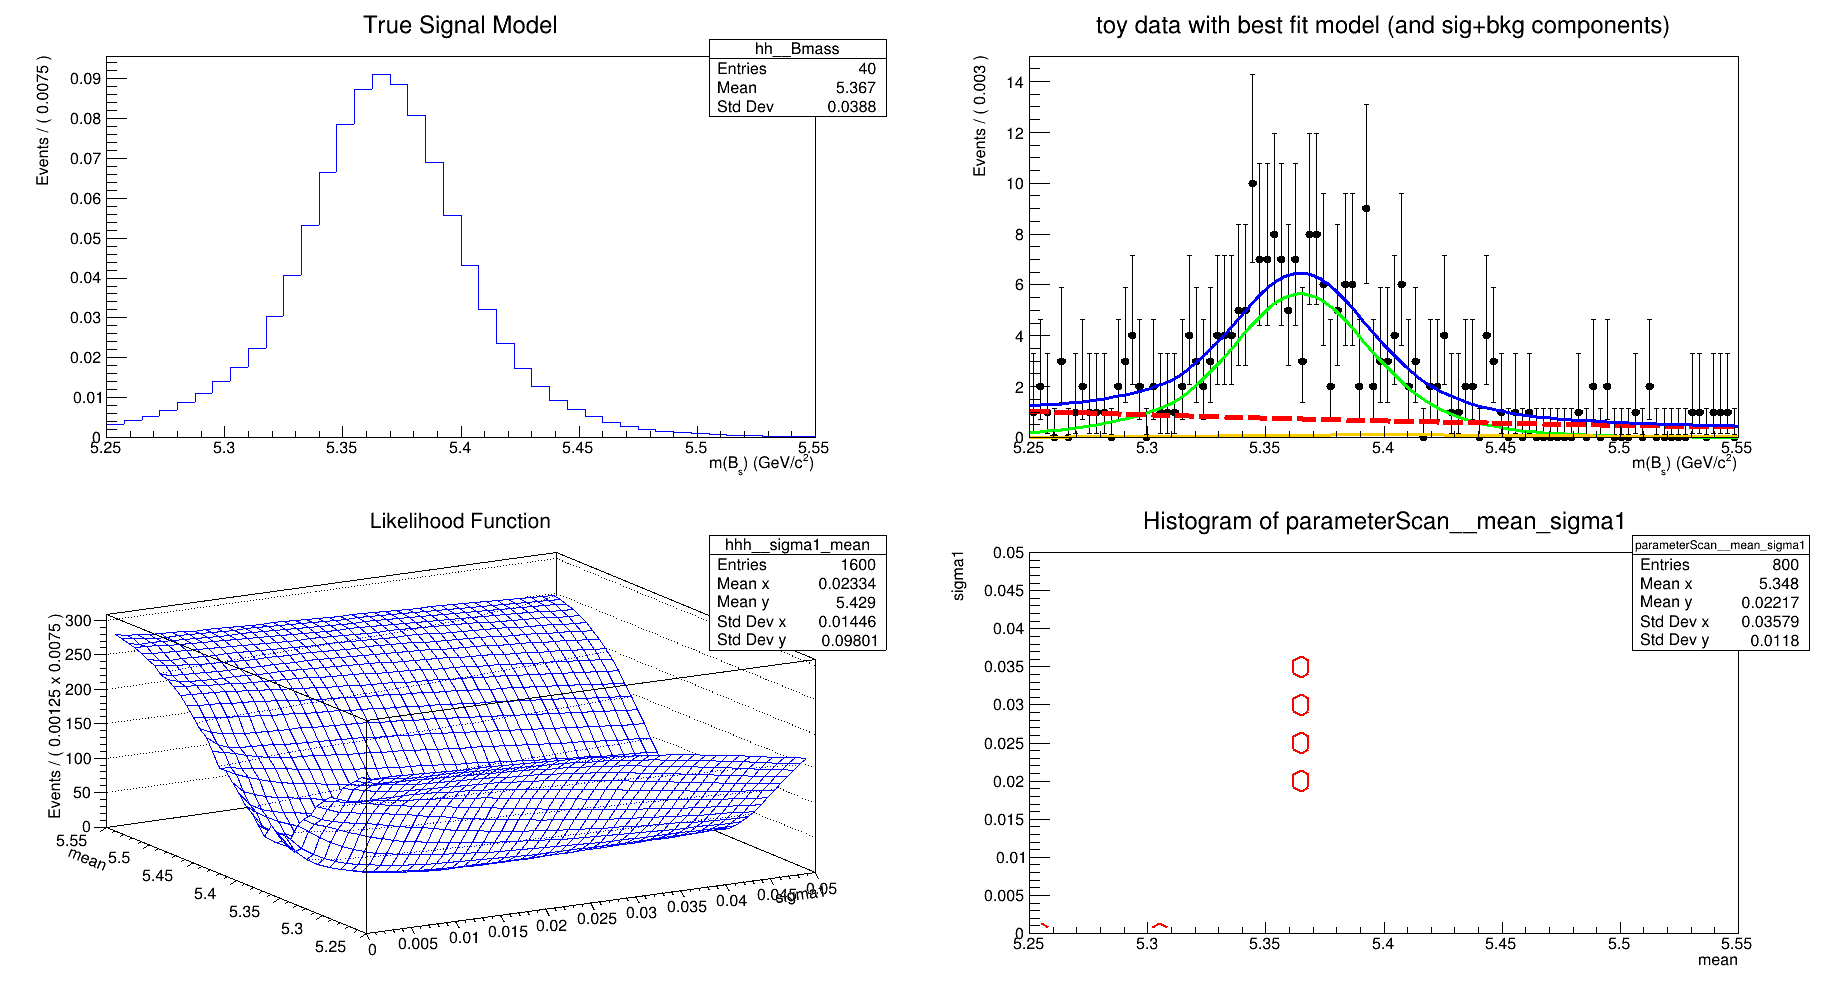
Currently, I am using a model where Bs mass is my variable and I have considered the mean and sigma1 to be my POI for demonstration.
When I draw the contours using the F-C test statistics, I am getting some weird tiny contour-like structure, but not really contours.
I have attached the plot and the script here.
(size of test = 0.05, number of points to test per parameter = 20, CL = 0.683)
Could you please have a look and let me know if I am doing anything wrong?
Regards,
Samar
Hi,
Can you please share the code you are using so I can have a look, probably not before tomorrow.
Thanks
Lorenzo
Hi,
Sure!
Please find the code.
FC_2D_test_2.C (10.0 KB)
Please have a look. I have already shared with you the code.
Regards,
Samar
Hi,
Thank you for sharing the code, it is very useful When trying with the new release it seems the model prints me a large number of error message for the undefined normalisation of the RooAddPdf.
I will investigate this further and let you know
Cheers
Lorenzo
Hi,
I think the problem is that you are performing the FC scan in a 20x20 region which is too large. Try to set the [min,max] values of the POI in a region around few sigma to the fitted value. For example reducing the POI interval, I am getting this plot (the FC contour is the red one and it is a 90% contour ) and should be the same (if asymptotic works) as the orange one from the profile likelihood.
plot.pdf (38.6 KB)
Cheers
Lorenzo
Dear Moneta,
Thanks a lot for looking into the issue. The F-C contour indeed looks better now.
Could you please share the script that you have used to get the plot so that I could able to reproduce the same?
Best regards,
Samar
Here it is (the CL of the Feldman cousins is 95% in this version).
I send you a link since I have some problems uploading the file
https://cernbox.cern.ch/index.php/s/H5c54MhmJu0tNaN
Lorenzo
Dear Moneta,
Thanks for sharing the modified code. I reproduced the contours and the plots are coming fine.
Thank you.
Regards,
Samar
Dear Moneta,
I have now modified the previous code accordingly to my Analysis, where I have used a 3D (Bs mass, CosThetak, CosThetaL) fitting model.
Now my POIs are two angular observables known as afb [ -1.0 -1.0] and fl [0.0-1.0], having a physical boundary region.
When I try to plot the likelihood of the above two variables, it throws me the following error,
error: no matching function for call to ‘YVar’
TH1 *hhh = pll.createHistogram(“hhh”, *afb, Binning(20), YVar(*fl, Binning(20)), Scaling(kFALSE));
^~~~
/home/samar/Downloads/root/include/RooGlobalFunc.h:265:11: note: candidate function not viable: no known conversion from ‘RooAbsReal’ to ‘const RooAbsRealLValue’ for 1st argument
RooCmdArg YVar(const RooAbsRealLValue& var, const RooCmdArg& arg=RooCmdArg::none()) ;
I couldn’t fix it. Could you please have a look?
I have attached the code and the workspace file here.
Best Regards,
Samar
FC_2D_test_8_ws.C (12.9 KB)
wspace_summaryLowQ2.root (69.5 KB)
Hi,
The problem is that you should pass a variable (i.e. a RooRealVar) in RooFit::YVar, instead you are passing fl which seems to be a function (a RooAbsReal object).
Lorenzo
Dear Moneta,
Sorry for the late reply. Yes, that’s correct, currently the variables (fl, afb) saved, are functions, not RooRealVar. But I want to plot the profiled likelihood of these two variables for my analysis.
Could you please suggest how can I do that?
Regards,
Samar
Hi,
I am confused, the likelihood must be a function of some parameters (variables) not function. If fl and afb are functions of something you should use their variables are the parameters of your problem.
Cheers
Lorenzo
Dear Lorenzo,
This is understood.
But is there any way to get the likelihood of a function instead of parameters?
Regards,
Samar
Hi,
Can you provide a concrete example ? You can always interpret a function as a parameter, and re-parametrize your problem. For example you can have a Likelihood L(p1,p2) and you can also parametrize as q1,q2 where q1(p1,p2) and q2(p1,p2) where q1 and q2 are functions of the parameters p1,p2. But when you describe the problem in RooFit you need to define them as variables and not as functions.
Cheers
Lorenzo
Dear Lorenzo,
I completely agree with you.
But I wanted to know if I have a Likelihood L(p1,p2), then how I can parametrize it in terms of q1, q2 where q1(p1, p2) and q2(p1, p2) (q1 and q2 are functions of the parameters p1,p2).
In my case, the parameters are unboundFl and unboundAfb, and the functions are fl and afb respectively, where
RooFormulaVar fl(“fl”, “0.5+TMath::ATan(*unboundFl)/TMath::Pi()”, RooArgList(*unboundFl))
RooFormulaVar afb(“afb”, “2.0*(1.-fl)*TMath::ATan(*unboundAfb)/TMath::Pi()”, RooArgList(*unboundAfb,fl)) .
Now I want to plot the likelihood between fl and afb, that’s my concern.
I have attached the likelihood plot between unboundFl and unboundAfb.
Regards,
Samar
3D_Model_test.pdf (35.9 KB)