I would like to draw a second x-axis on top of my plot. This seems to work as long as I do not want to change my plotting range (graph->GetXaxis()->SetRangeUser(min,max) and as long as I am not setting the y-axis in logscale. I looked for solutions in previous postings, but unfortunately I could not find any [1-4].
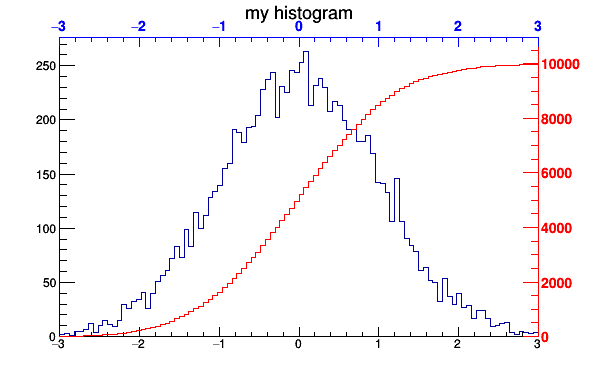
To illustrate what I am doing, I added a couple of lines to the well-known example twoscales.C [5]:
TGaxis *axis2 = new TGaxis(gPad->GetUxmin(),gPad->GetUymax(),
gPad->GetUxmax(), gPad->GetUymax(),mymin,mymax,510,"-L");
axis2->SetLineColor(kBlue);
axis2->SetLabelColor(kBlue);
axis2->Draw();
this just works fine as long as one does not play with SetRangeUser of SetLogy.
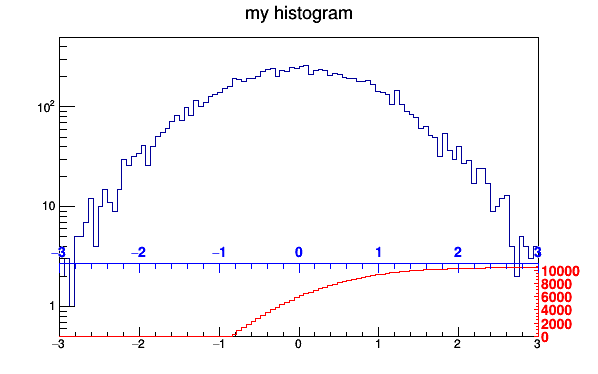
Indicating right after creating the canvas that you want to have log-scale for the y-axis results in
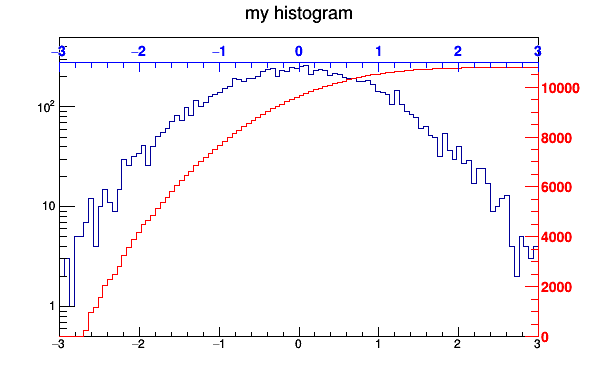
Indicating at the end that you want to have log-scale for the y-axis gives a different result
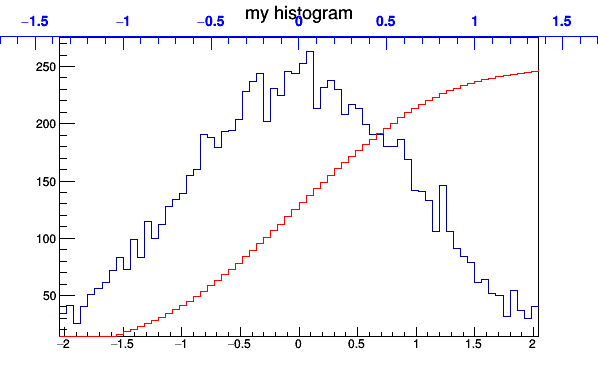
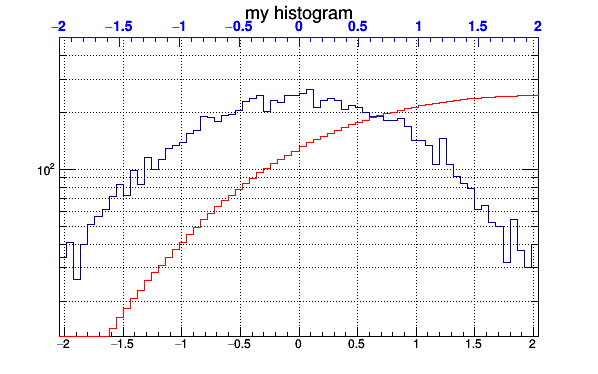
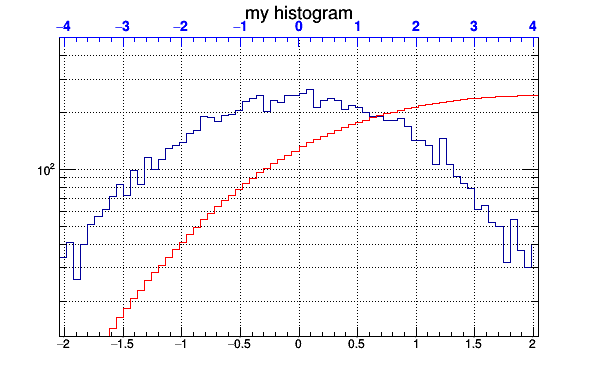
Unfortunately for my usecase it is necessary to use SetRangeUser, both on y and x-axis. On the x-axis I need it because I have several tgraphs in my plot and the range of the x-axis starts a little bit before the first x-value and ranges to a max-value, slightly higher than my last x-value. To let the thicks (and the values!) of the second x-axis correspond exactly with the values of the first x-axis I do not see an alternative to manually imposing the range of the plot. However using SetRangeUser results also in a strange result:
Does anyone have suggestions how to work with TGaxis when using SetRangeUser and SetLogy? I have attached the modified twoscales.C. twoscales.C (2.2 KB)
Thanks a lot for any suggestion!
To be independent of the changes in coordinates you will do on the main pad I suggest you draw your axis on an overlaid transparent pad as shown in the following example:
{
   TCanvas *c1 = new TCanvas("c1","transparent pad",200,10,700,500);

   TH1F *h1 = new TH1F("h1","h1",100,-3,3);
   TRandom r;
   for (Int_t i=0;i<100000;i++) h1->Fill(r.Gaus(-1,0.5));
   h1->Draw();
   c1->SetLogy(kTRUE);

   TPad *pad2 = new TPad("pad2","",0,0,1,1);
   pad2->SetFillStyle(0);
   pad2->SetFillColor(0);
   pad2->SetFrameFillStyle(0);
   pad2->SetBorderSize(0);
   pad2->SetFrameLineWidth(0);
   pad2->SetFrameBorderMode(0);

   pad2->Draw();
   pad2->cd();
   TGaxis *axis = new TGaxis(0.1,0.9,0.9, 0.9,-3.,3,510,"-L");;
   axis->SetLabelColor(kRed);
   axis->Draw();
}
Thanks. I am almost there now.
The only point that is not 100% satisfactory is that when changing the range on the x-axis (SetRangeUser(mymin,mymax)), the range is not exactly the range I set, it is mymin-epsilon, mymax+epsilon. Do you have any idea how epsilon is defined? I have attached my updated twoscale macro twoscalestranspad.C (2.5 KB)
I see what you mean: there is a little margin below -2 and above 2 on the X axis drawn at the bottom of the pad (the black one).
This is because SetRangeUser is based on the histogram’s bins. When you set a range the two values you give are converted into bin numbers and there is a high likelihood that the values you give are not matching exact bin’s limits.
But at least the top blue axis should follow the black bottom one.
Thanks, Now I have worked it out.
Obviously I did not want to have the same scale for the top and bottom axis, so I was a bit hesitant to adopt GetUxmin() and GetUxmax(). I saw that it was important to have (a couple) of c1->Update() before the changes got propagated to GetUxmin(). To get my final result I extracted epsilon and scaled the top x-axis correctly. I have attached my macro twoscalestranspad.C (2.8 KB).
Thanks a lot for the quick feedback
greets
Piet