[quote=“couet”]
It seems similar to the previous one… they overlap … I will try your example.[/quote]
In my previous post, for a unclear reason, the insert plots appeared in the opposite order of what I would like. This may lead to some confusion. I don’t know how to correct it.
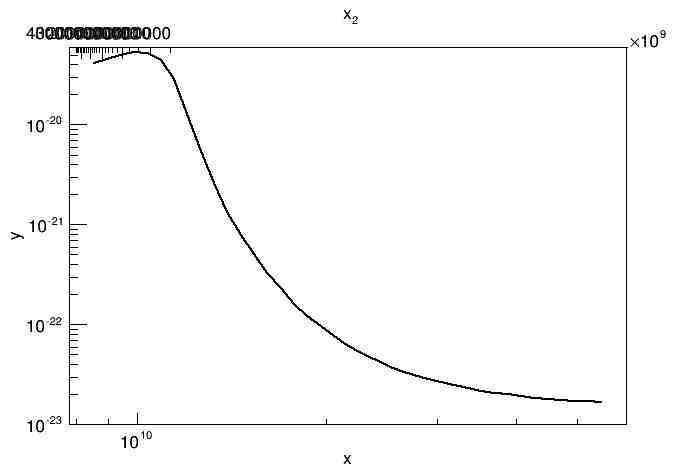
For the second problem, I don’t exactly mean the overlapping issue. Because there is *10^3 at the right hand side of the axis, the label should be 500 etc., instead of 500000 etc (see c2.jpg which appeared first).
This is an example code to show my problem.
#include <iostream>
#include <cmath>
#include "TGraph.h"
#include "TPad.h"
#include "TAxis.h"
#include "TGaxis.h"
#include "TF1.h"


double myfun(double x)
{
  return log10(1E11*pow(x,-0.1));
}

void myplot()
{
  double xmin=8E9, xmax=6E10, ymin=1E-23, ymax=6E-20;

  TGraph *graph = new TGraph(39);
  graph->SetName("g1");
  graph->SetTitle(";x;y");
  graph->SetFillColor(1);
  graph->SetLineWidth(2);
  graph->SetPoint(0,8545860000,4.11899e-20);
  graph->SetPoint(1,8973150000,4.50051e-20);
  graph->SetPoint(2,9421810000,4.97267e-20);
  graph->SetPoint(3,9892900000,5.25857e-20);
  graph->SetPoint(4,1.03875e+10,5.13659e-20);
  graph->SetPoint(5,1.09069e+10,4.36635e-20);
  graph->SetPoint(6,1.14523e+10,2.87258e-20);
  graph->SetPoint(7,1.20249e+10,1.26819e-20);
  graph->SetPoint(8,1.26261e+10,5.47309e-21);
  graph->SetPoint(9,1.32574e+10,2.6004e-21);
  graph->SetPoint(10,1.39203e+10,1.3383e-21);
  graph->SetPoint(11,1.46163e+10,7.9109e-22);
  graph->SetPoint(12,1.53471e+10,5.02711e-22);
  graph->SetPoint(13,1.61145e+10,3.2867e-22);
  graph->SetPoint(14,1.69202e+10,2.28594e-22);
  graph->SetPoint(15,1.77662e+10,1.60714e-22);
  graph->SetPoint(16,1.86545e+10,1.20593e-22);
  graph->SetPoint(17,1.95873e+10,9.62566e-23);
  graph->SetPoint(18,2.05666e+10,7.59517e-23);
  graph->SetPoint(19,2.1595e+10,6.21226e-23);
  graph->SetPoint(20,2.26747e+10,5.16032e-23);
  graph->SetPoint(21,2.38084e+10,4.46091e-23);
  graph->SetPoint(22,2.49989e+10,3.83897e-23);
  graph->SetPoint(23,2.62488e+10,3.4393e-23);
  graph->SetPoint(24,2.75613e+10,3.09639e-23);
  graph->SetPoint(25,2.89393e+10,2.83612e-23);
  graph->SetPoint(26,3.03863e+10,2.63614e-23);
  graph->SetPoint(27,3.19056e+10,2.46388e-23);
  graph->SetPoint(28,3.35009e+10,2.30246e-23);
  graph->SetPoint(29,3.51759e+10,2.17472e-23);
  graph->SetPoint(30,3.69347e+10,2.07338e-23);
  graph->SetPoint(31,3.87815e+10,2.00194e-23);
  graph->SetPoint(32,4.07205e+10,1.91677e-23);
  graph->SetPoint(33,4.27565e+10,1.8508e-23);
  graph->SetPoint(34,4.48944e+10,1.79028e-23);
  graph->SetPoint(35,4.71391e+10,1.74895e-23);
  graph->SetPoint(36,4.9496e+10,1.72176e-23);
  graph->SetPoint(37,5.19709e+10,1.69628e-23);
  graph->SetPoint(38,5.45694e+10,1.6593e-23);

  graph->Draw("AL");
  graph->GetXaxis()->CenterTitle();
  graph->GetYaxis()->CenterTitle();
  graph->GetYaxis()->SetLabelSize(0.04);
  graph->GetXaxis()->SetLabelSize(0.04);
  graph->GetYaxis()->SetTitleSize(0.04);
  graph->GetXaxis()->SetTitleSize(0.04);

  graph->GetXaxis()->SetRangeUser(xmin,xmax);
  graph->GetYaxis()->SetRangeUser(ymin,ymax);
  gPad->SetLogx();
  gPad->SetLogy();
  gPad->SetTicky(0);
  gPad->SetTickx(0);

  TF1 *f1=new TF1("f1","myfun(x)",427,4.8E10);
  TGaxis *axis2=new TGaxis(xmin,ymax,xmax,ymax,"f1",505,"-");
  axis2->SetTitle("x_{2}");
  axis2->SetLabelFont(42);
  axis2->SetLabelSize(0.04);
  axis2->SetTitleFont(42);
  axis2->SetTitleSize(0.04);
  axis2->SetMaxDigits(2);
  axis2->CenterTitle();
  axis2->Draw();
}
I got a plot like this.
Thank you for your help.
