How to make plot with an equivalent x axis on the top

I have a question on how to make an equivalent x axis on the top of the graph.
For example, like the plot I attached, I want to draw a spectrum against frequency as x axis at bottom and also show the wavelength as another x axis at the top.
In the example, there is a simple relation between frequency and wavelength. For the plot I really want to draw, the relation is more complicated. But I can create a TF1 to express the dependence of one axis on the other.

I tried to draw another x axis with TGaxis. But I’m confused by the TGaxis example and I can’t make it works.
The following code is copied from the TGaxis example,

TF1 *f2=new TF1("f2","exp(x)",0,2); TGaxis *A2 = new TGaxis(1,1,9,1,"f2"); A2->SetTitle("exponential axis"); A2->SetLabelSize(0.03); A2->SetTitleSize(0.03); A2->SetTitleOffset(1.2); A2->Draw();
The plotted axis range is 0 to 2 rather than exp(0) to exp(2), which is counter intuitive to me. Could you please explain how the TF1 decide the location of ticks? What does x and exp(x) means? How can I create the TF1 to accomplish my task? Or is there another way to draw the axis?

Thank you very much.

{
   TCanvas *c1 = new TCanvas("c1","c1",200,10,700,500);
   TPad *pad1 = new TPad("pad1","",0,0,1,1);
   TPad *pad2 = new TPad("pad2","",0,0,1,1);
   pad2->SetFillColor(0);
   pad2->SetFillStyle(0);
   pad2->SetFrameFillStyle(0);

   pad1->Draw();
   pad1->cd();

   TH1F *h1 = new TH1F("h1","h1",100,-3,3);
   TH1F *h2 = new TH1F("h2"," ",100,-5,5);
   TRandom r;
   for (Int_t i=0;i<100000;i++) {
      Double_t x1 = r.Gaus(-1,0.5);
      h1->Fill(x1);
      Double_t x2 = r.Gaus(0,0.75);
      h2->Fill(x2);
   }

   h1->Draw();

   pad2->Draw();
   pad2->cd();
   h2->GetYaxis()->SetLabelSize(0.);
   h2->SetLineColor(kRed);
   h2->GetYaxis()->SetTickSize(0.);
   h2->Draw("X+");
}

Hi couet,

Thank you. But I think you misunderstand my question.

I want a single TGraph (or TH1) plot with different x scale shown in the plot. Because two x axes are related with a given function, at least one axis would be in a nonlinear pattern. I’m not sure how to draw such a non-linear axis.

I attach another example plot to show what I mean.


I have the relation of universe age etc. against the redshift. I want the universe age as one x axis and the equivalent redshift as the other x axis on the top of the plot.

An unrelated question. To run the code you attached, no matter I execute the code or compile the code, I always get a error message like

error: ‘class TAxis’ has no member named ‘SetTickSize’

Yes in that case you should use TGaxis with a function defining tick marks.
SetTickLength (in some older version)

[quote=“couet”]Yes in that case you should use TGaxis with a function defining tick marks.
SetTickLength (in some older version)[/quote]
OK, thanks. I can run this example now. But I don’t see how this example code is related to my initial question.

It works like log scale. In log scale the ticks are plotted following log(x) and the label are x.

[quote=“couet”][quote]
The plotted axis range is 0 to 2 rather than exp(0) to exp(2), which is counter intuitive to me.
[/quote]

It works like log scale. In log scale the ticks are plotted following log(x) and the label are x.[/quote]

Thank you. The answer is helpful. But I still have difficulty on making the plot. I have several problem in making the plot.

First problem, all labels squeeze at one side of the axis
Just like the plot I attached in my first post, the top axis is nonlinear. If I simply plot a TGaxis at the top, the label will be added linearly. The result is that all labels squeeze at one side of the axis, as the one shown below.


This is the part of code I used to plot the axis on the top.

  TF1 *ftau=new TF1("ftau","fx2(x)",1,2.3E7);
  TGaxis *axis2=new TGaxis(xmin,ymax,xmax,ymax,"ftau",505,"-");
  axis2->SetTitle("Line center optical depth to top #tau");
  axis2->SetLabelFont(42);
  axis2->SetLabelSize(0.04);
  axis2->SetTitleFont(42);
  axis2->SetTitleSize(0.04);
  axis2->SetMaxDigits(2);
  axis2->CenterTitle();
  axis2->Draw();

If I add “G” chopt option, the axis would just be a simple log scale, not the one I want.

=======================================

Second problem. The label is wired if the number is large.
I adjusted the range of axis to see the label more clearly.

  TF1 *ftau=new TF1("ftau","fx2(x)",1E5,2.3E6);

I got an axis looks like


There is a 10^3 factor at the end of the axis already, but the labels were not divided by this 10^3.

========================================

Third problem. SetMaxDigits doesn’t work
I try to use

  axis2->SetMaxDigits(2);

to force the label shown in scientific notation. But it seems that this line doesn’t change anything. I don’t know why.

You mean that the long label overlaps ? I will try your example…
Don’t use G with “function labels”

It seems similar to the previous one… they overlap … I will try your example.

One little request : Can you provide me a small example I can directly run reproducing your problem ?
Thanks in advance.

[quote=“couet”]

It seems similar to the previous one… they overlap … I will try your example.[/quote]

In my previous post, for a unclear reason, the insert plots appeared in the opposite order of what I would like. This may lead to some confusion. I don’t know how to correct it.

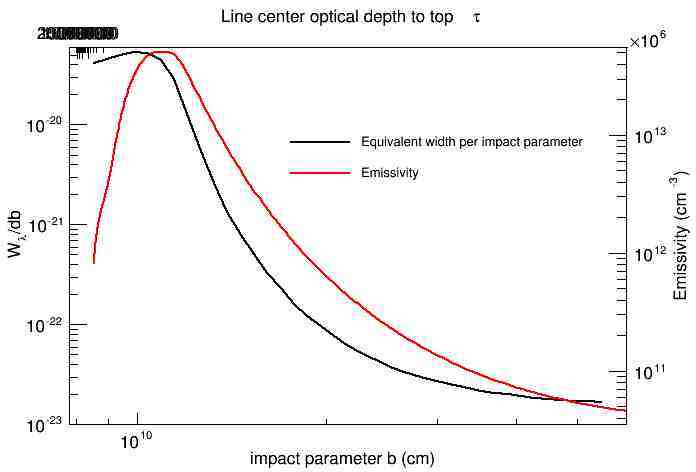
For the second problem, I don’t exactly mean the overlapping issue. Because there is *10^3 at the right hand side of the axis, the label should be 500 etc., instead of 500000 etc (see c2.jpg which appeared first).

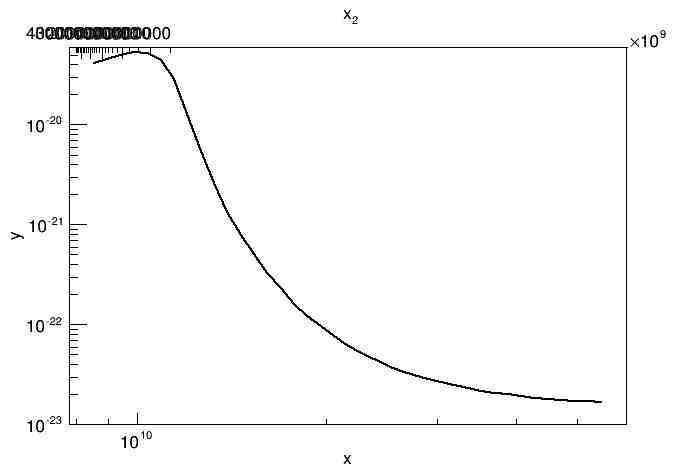
This is an example code to show my problem.

#include <iostream>
#include <cmath>
#include "TGraph.h"
#include "TPad.h"
#include "TAxis.h"
#include "TGaxis.h"
#include "TF1.h"


double myfun(double x)
{
  return log10(1E11*pow(x,-0.1));
}

void myplot()
{
  double xmin=8E9, xmax=6E10, ymin=1E-23, ymax=6E-20;
  
  TGraph *graph = new TGraph(39);
  graph->SetName("g1");
  graph->SetTitle(";x;y");
  graph->SetFillColor(1);
  graph->SetLineWidth(2);
  graph->SetPoint(0,8545860000,4.11899e-20);
  graph->SetPoint(1,8973150000,4.50051e-20);
  graph->SetPoint(2,9421810000,4.97267e-20);
  graph->SetPoint(3,9892900000,5.25857e-20);
  graph->SetPoint(4,1.03875e+10,5.13659e-20);
  graph->SetPoint(5,1.09069e+10,4.36635e-20);
  graph->SetPoint(6,1.14523e+10,2.87258e-20);
  graph->SetPoint(7,1.20249e+10,1.26819e-20);
  graph->SetPoint(8,1.26261e+10,5.47309e-21);
  graph->SetPoint(9,1.32574e+10,2.6004e-21);
  graph->SetPoint(10,1.39203e+10,1.3383e-21);
  graph->SetPoint(11,1.46163e+10,7.9109e-22);
  graph->SetPoint(12,1.53471e+10,5.02711e-22);
  graph->SetPoint(13,1.61145e+10,3.2867e-22);
  graph->SetPoint(14,1.69202e+10,2.28594e-22);
  graph->SetPoint(15,1.77662e+10,1.60714e-22);
  graph->SetPoint(16,1.86545e+10,1.20593e-22);
  graph->SetPoint(17,1.95873e+10,9.62566e-23);
  graph->SetPoint(18,2.05666e+10,7.59517e-23);
  graph->SetPoint(19,2.1595e+10,6.21226e-23);
  graph->SetPoint(20,2.26747e+10,5.16032e-23);
  graph->SetPoint(21,2.38084e+10,4.46091e-23);
  graph->SetPoint(22,2.49989e+10,3.83897e-23);
  graph->SetPoint(23,2.62488e+10,3.4393e-23);
  graph->SetPoint(24,2.75613e+10,3.09639e-23);
  graph->SetPoint(25,2.89393e+10,2.83612e-23);
  graph->SetPoint(26,3.03863e+10,2.63614e-23);
  graph->SetPoint(27,3.19056e+10,2.46388e-23);
  graph->SetPoint(28,3.35009e+10,2.30246e-23);
  graph->SetPoint(29,3.51759e+10,2.17472e-23);
  graph->SetPoint(30,3.69347e+10,2.07338e-23);
  graph->SetPoint(31,3.87815e+10,2.00194e-23);
  graph->SetPoint(32,4.07205e+10,1.91677e-23);
  graph->SetPoint(33,4.27565e+10,1.8508e-23);
  graph->SetPoint(34,4.48944e+10,1.79028e-23);
  graph->SetPoint(35,4.71391e+10,1.74895e-23);
  graph->SetPoint(36,4.9496e+10,1.72176e-23);
  graph->SetPoint(37,5.19709e+10,1.69628e-23);
  graph->SetPoint(38,5.45694e+10,1.6593e-23);

  graph->Draw("AL");
  graph->GetXaxis()->CenterTitle();
  graph->GetYaxis()->CenterTitle();
  graph->GetYaxis()->SetLabelSize(0.04);
  graph->GetXaxis()->SetLabelSize(0.04);
  graph->GetYaxis()->SetTitleSize(0.04);
  graph->GetXaxis()->SetTitleSize(0.04);

  graph->GetXaxis()->SetRangeUser(xmin,xmax);
  graph->GetYaxis()->SetRangeUser(ymin,ymax);
  gPad->SetLogx();
  gPad->SetLogy();
  gPad->SetTicky(0);
  gPad->SetTickx(0);

  TF1 *f1=new TF1("f1","myfun(x)",427,4.8E10);
  TGaxis *axis2=new TGaxis(xmin,ymax,xmax,ymax,"f1",505,"-");
  axis2->SetTitle("x_{2}");
  axis2->SetLabelFont(42);
  axis2->SetLabelSize(0.04);
  axis2->SetTitleFont(42);
  axis2->SetTitleSize(0.04);
  axis2->SetMaxDigits(2);
  axis2->CenterTitle();
  axis2->Draw();
}

I got a plot like this.


Thank you for your help.

I tried a few things. I am afraid except reducing the label size there is not much we can do on such an axis…
Sorry.