Dear experts,
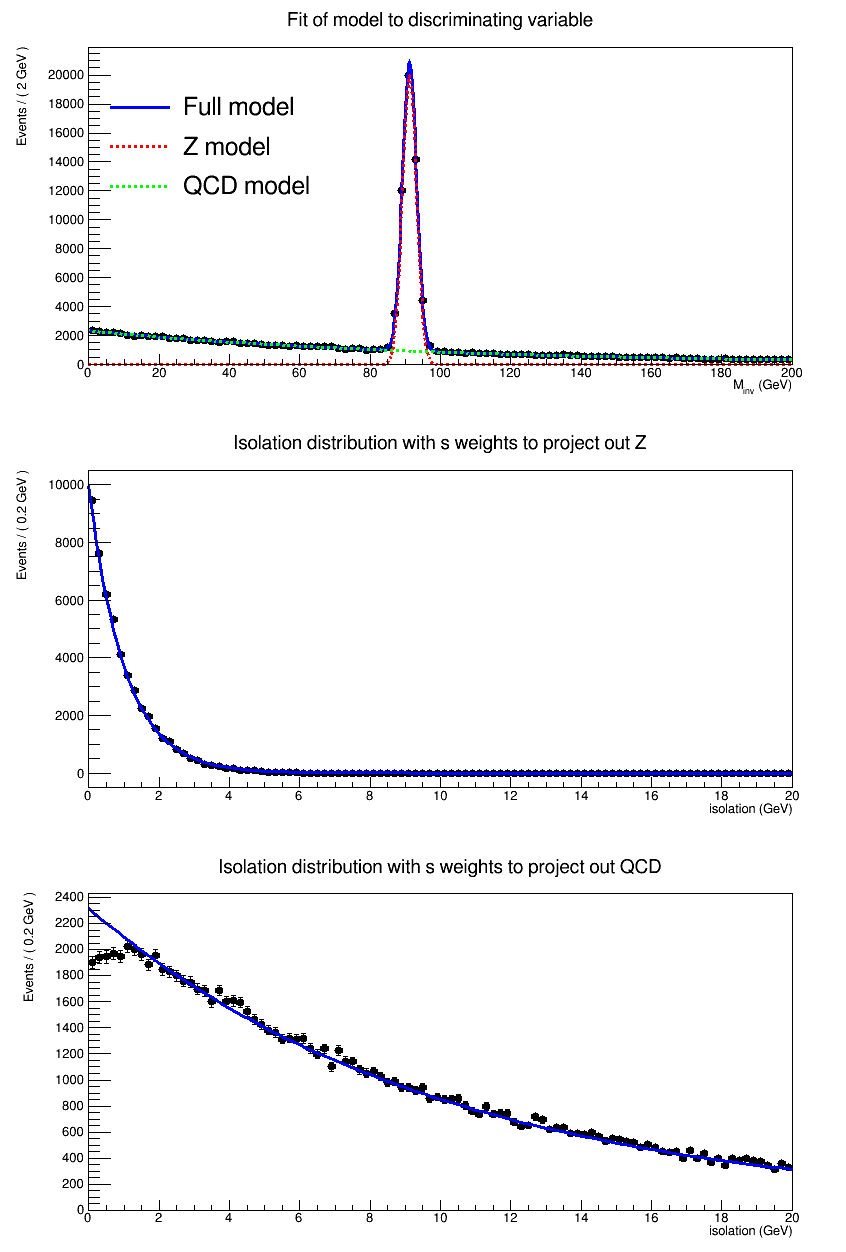
I’m trying rs301_splot.C with high statistics (100x of that in the original example) and see some disagreement in lower side of the QCD isolation distribution (see the bottom plot in the figure below). Is this expected?
Thanks for the reply. The fit converges in the end and the final values are consistent with the input. So I guess it’s not due to fit. And I also tried run the sPlot without fit, in which case the the signal yield and background yield are their input values, similar discrepancy is observed.
excellent, thank you very much for spotting this! Very good call
The tutorial is actually using the SPlots class wrong. It is calculating sWeights for the isolation based on the invariant mass and the isolation itself. That’s wrong. For sPlots, the control variable should not be in the set of discriminating variables for the likelihood fit! See https://arxiv.org/pdf/physics/0402083.pdf.
That means when using the SPlot class, you should exclude the isolation variable from the dataset that you pass. In the tutorial, this would look like that:
   RooRealVar *invMass = ws->var("invMass");

   // Now we use the SPlot class to add SWeights for the isolation variable to
   // our data set based on fitting the yields to the invariant mass variable
   std::unique_ptr<RooDataSet> dataInvMass{static_cast<RooDataSet*>(data->reduce(RooFit::SelectVars(*invMass)))};
   RooStats::SPlot *sData = new RooStats::SPlot("sData", "An SPlot", *dataInvMass, model, RooArgList(*zYield, *qcdYield));
   // Merge the sWeights that are now added to dataInvMass to the dataset in the workspace
   data->merge(dataInvMass.get());
Here is the fixed tutorial file: rs301_splot.C (12.2 KB)
.
Hi Jonas,
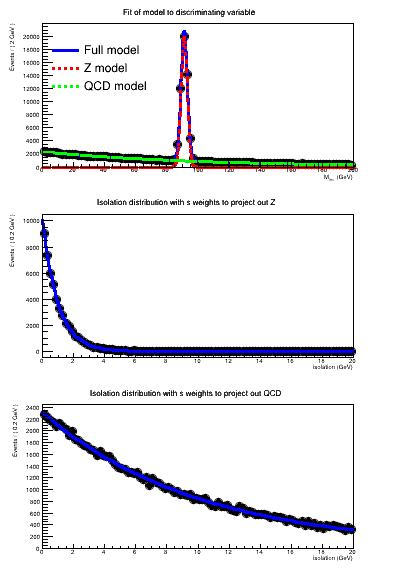
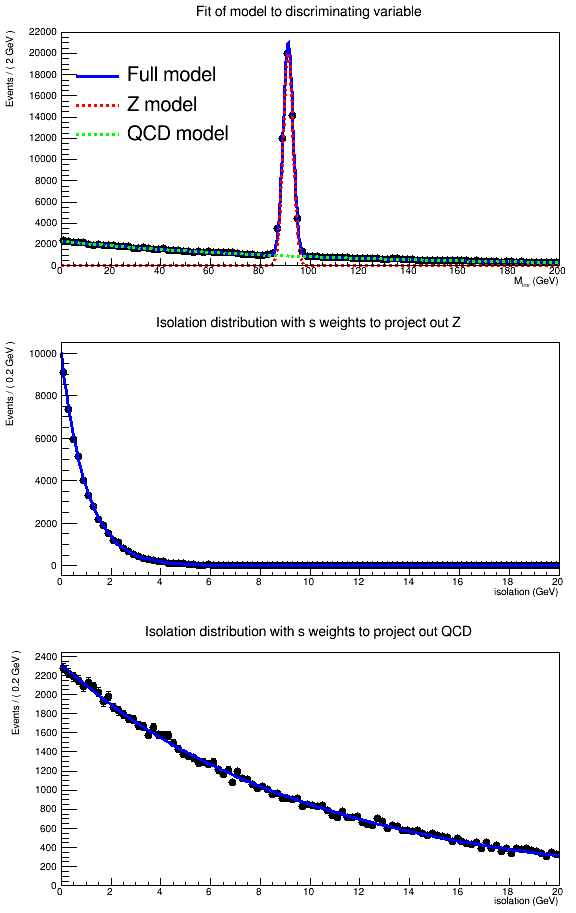
Thanks a lot for the investigation and the fix. You mentioned that “the control variable should not be in the set of discriminating variables for the likelihood fit”, so I’m trying to use only the invMass variable in the fit PDF instead of removing the isolation variable from the dataset. Will this give me correct results? The plots from my test script seem reasonable…(the test script rs301_splot.C (12.0 KB)
and the output plot below)
Yes, that’s equivalent. And actually I like your approach better of changing the model instead of the data, because it doesn’t involve creating a new copy of the data. I do in the PR now the same as you.
Additional note: you can get rid of the model1.fitTo() call in your script, as it is redundant. The SPlot class does this internally.