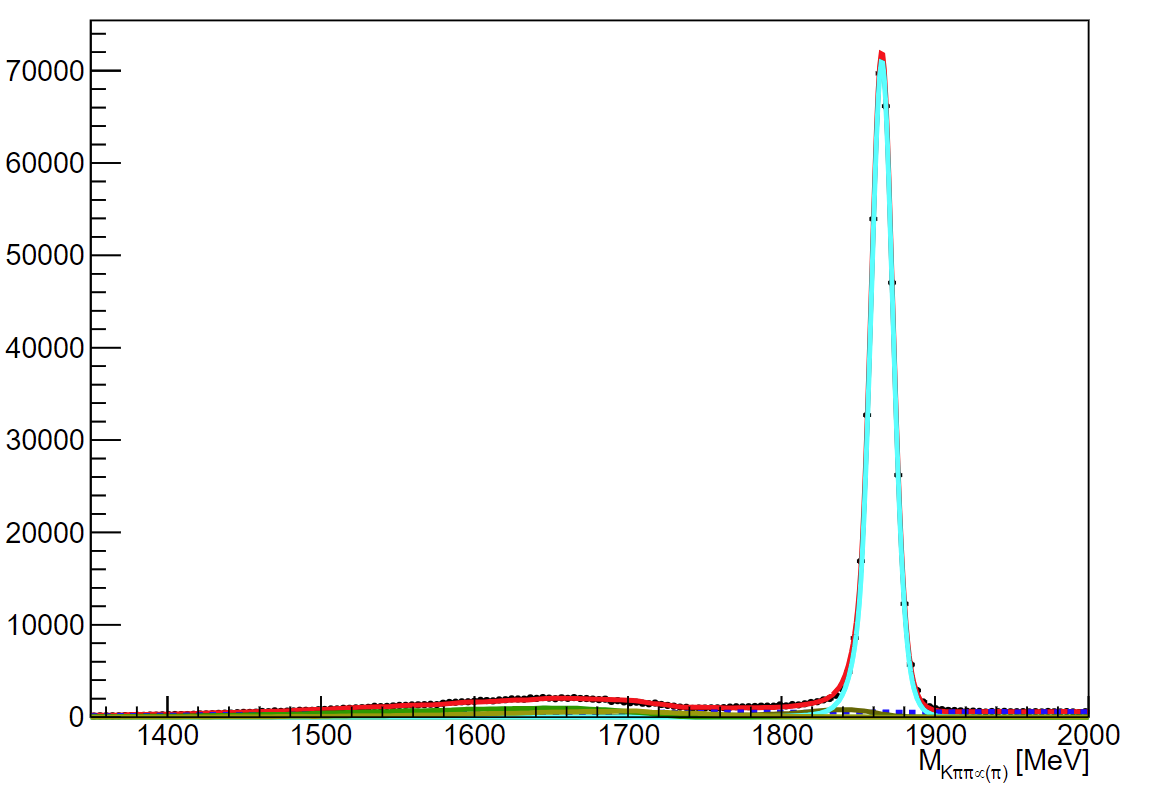
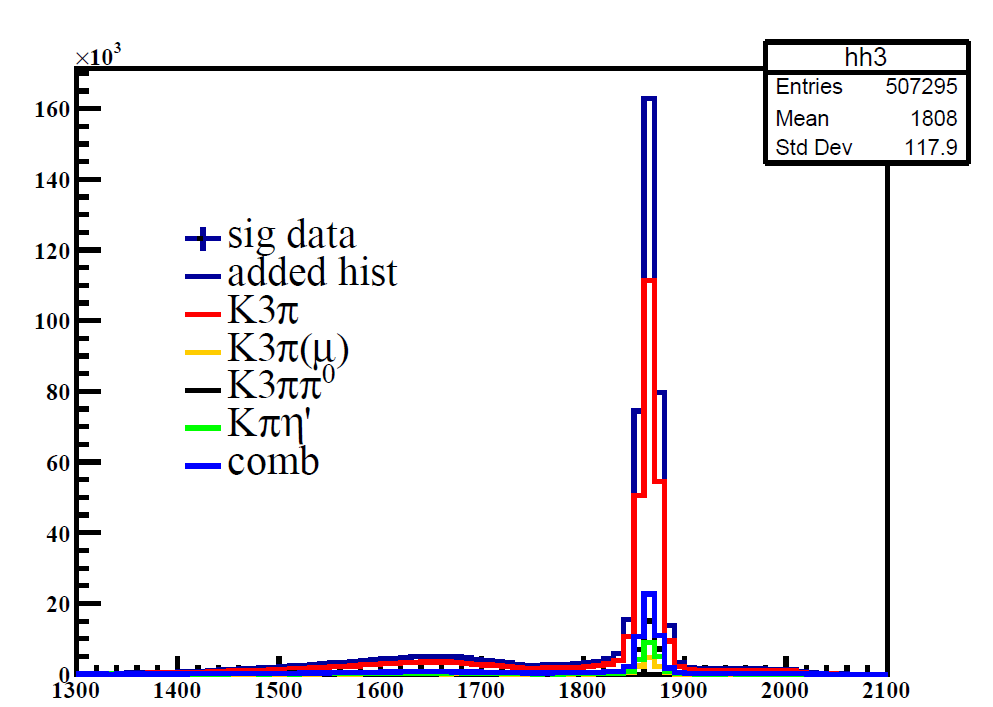
Here, the bottom picture shows all the components have a peak near 1860MeV. But In the top one, only one component has a peak.
I also find a similar question, Strange results in rs301_splot.C? - Roofit and RooStats - ROOT Forum (cern.ch)
which says the control variable should not be in the set of discriminating variables for the likelihood fit!
Obviously, in my situation, the control variable and discriminating variable are the same one.
That means I can’t get the sweight for discriminating/fitting variable because we have known the pdf/models/distribution to do fit.
Can I understand in this way?
Indeed, the formula for the sWeights works only if the sWeights variable is not in the set of discriminating variables. This is the whole point of sPlots, as you can read in the paper:
If the control variable is used for discrimination the fit, the sWeights make no sense at all. Then you have the situation which the paper calls “inPlot” (see section 3 in the linked paper).
In that case, you don’t need sWeights. You can directly get the probabilities for the different components by evaluating the component PDFs that you are adding in the final RooAddPdf.