Hi,
this is a follow-up on the topic 39624, which is closed by now. I was asking if it’s possible to plot two TH2s with very different statistics without having to “share” the z-axis scale between the two histograms.
Here is some explanation:
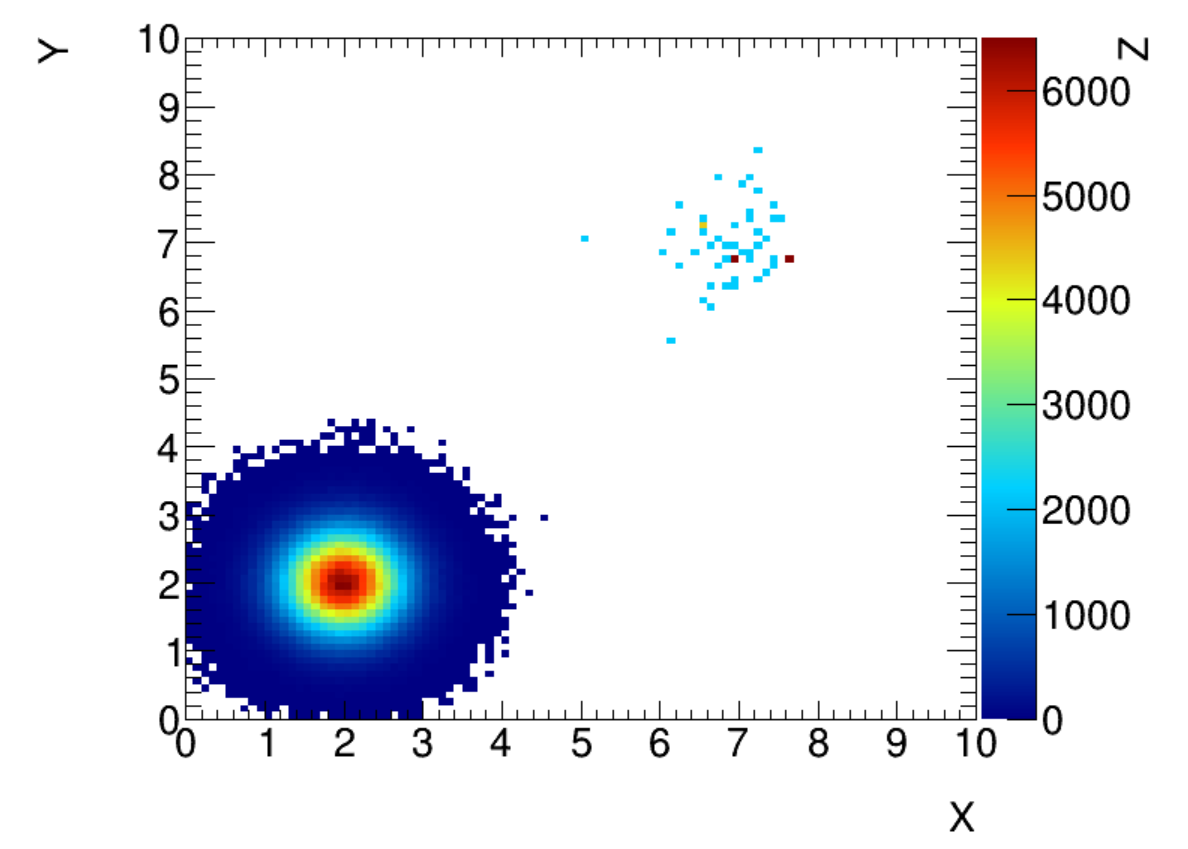
suppose I plot two 2D Gaussians, one (bottom left) with large statistics and another (top right) with very small statistics.

I’d like to have the color scale of this second histogram to also go from blue to red. Instead, all the values are blue because blue is the color of bins filled with 1 in the first histogram.
@Wile_E_Coyote came up with a solution of using
bottomLeftHistogram->DrawNormalized("col", bottomLeftHistogram->Integral() / bottomLeftHistogram->GetMaximum());
topRightHistogram->DrawNormalized("same col", topRightHistogram->Integral() / topRightHistogram->GetMaximum());
instead of simple
bottomLeftHistogram->Draw("col");
topRightHistogram->Draw("same col");
Indeed, this did the trick:
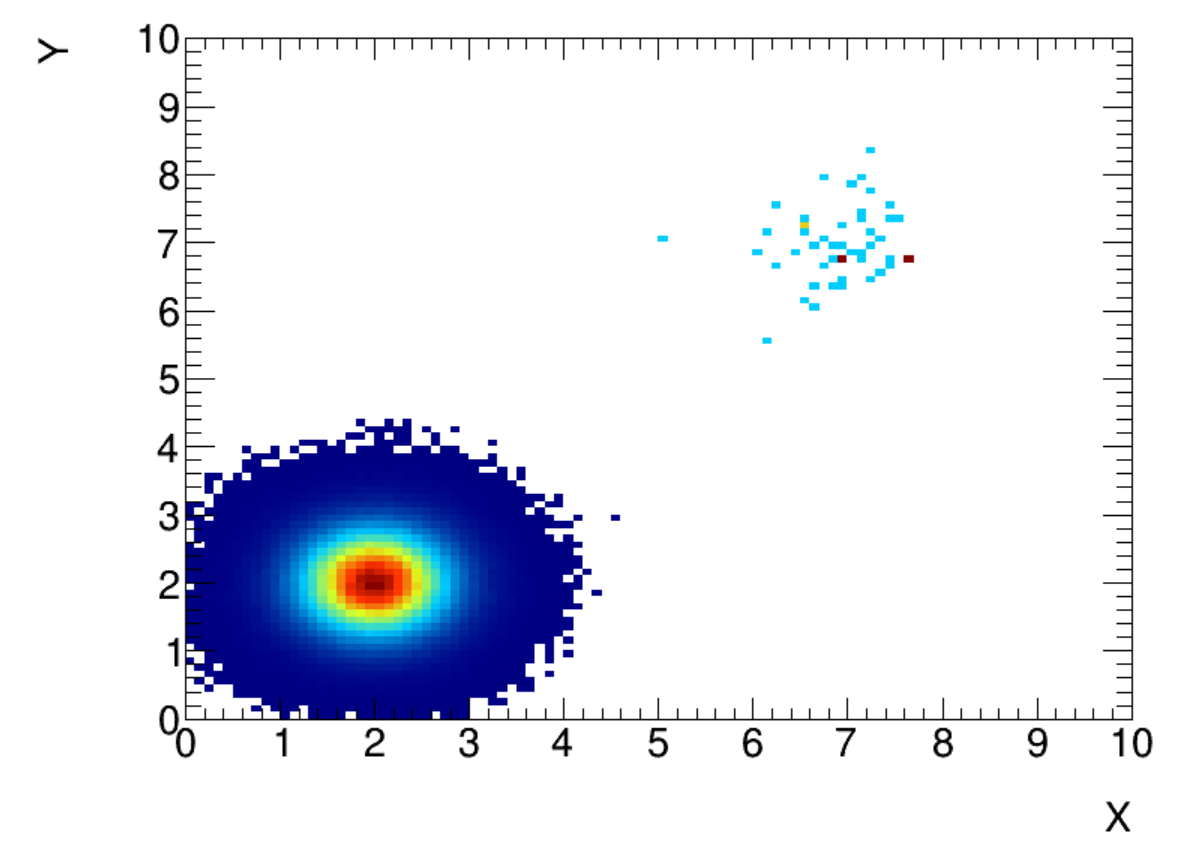
, and I marked that question as “Solved”.
Now I’d like to also plot the z-axis scale of the first histogram, something we do with the colz option instead of col. But since the histogram was normalized, all the z-axis values are now between 0 and 1:
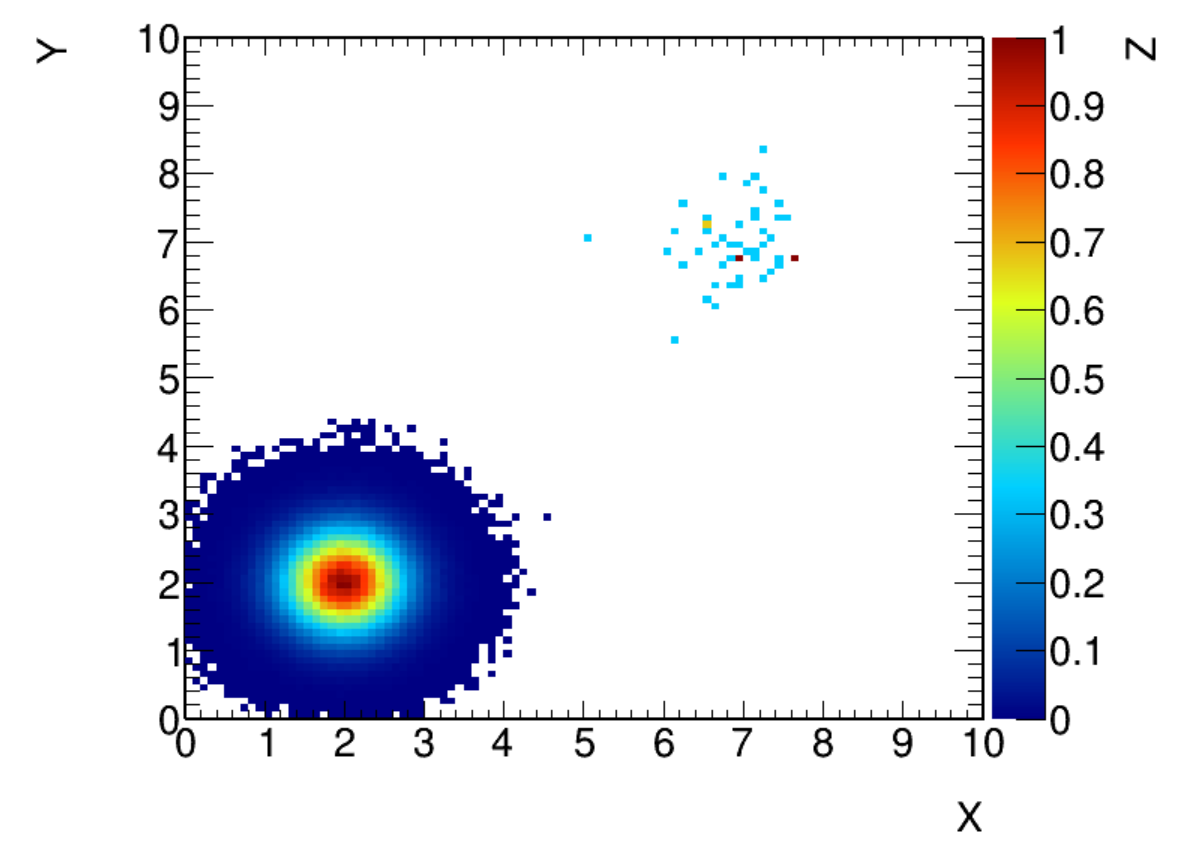
My new question is whether its possible to do all the same but somehow to keep the z axis as it was, so that the z-axis scale gave the actual numbers, before the normalization. Is there any way to achieve this? This would involve getting rid of the normalization, but then how do I achieve my first goal (in the topic from a year ago)?
Thanks!
ROOT Version: 6.14/04