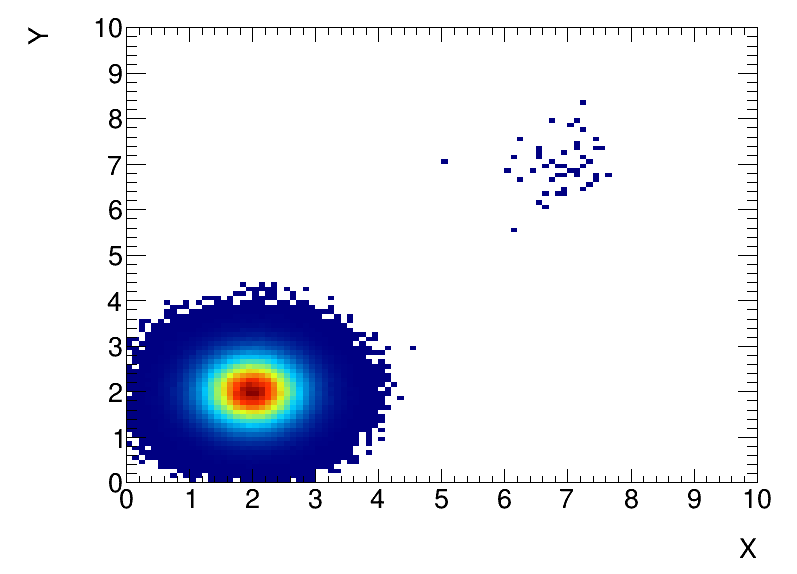
But when I want these histograms to have very different statistics, for example, by setting statsForThe2ndHistogram to 50 (instead of 1e6) in my function above, I get this:
The problem is the bin colors of the top right histogram: pretty much all its bins are filled only once now, which corresponds to deep blue on the bottom left histogram. The two histograms seem to “share” the z-axis scale. What I want is to draw this top right histogram with its own scale, as if the bottom left histogram does not exist:
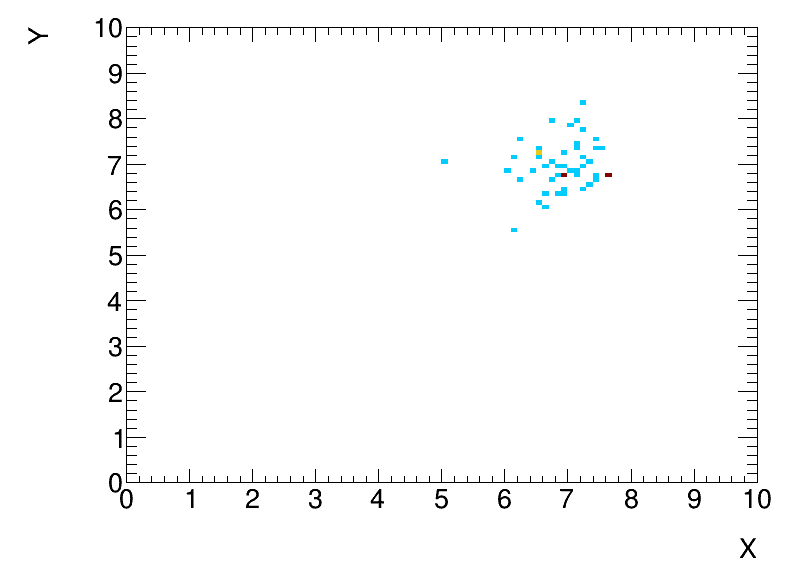
No, I showed the “expected” color distribution above (I copy that picture below just in case). Cyan means content = 1, yellow means 2, dark red means 3. I would expect to get exactly the same color distribution.