#include “TGaxis.h”
#include “TCanvas.h”
#include <TGraphErrors.h>
#include <TStyle.h>
#include <TPie.h>
#include <TROOT.h>
#include <TFile.h>
int anglescan()
{
TCanvas *c = new TCanvas(“c”,“canvas”,0,0,1200,700);
c->Divide(2,1);
TGraph2D *dt = new TGraph2D();
dt->SetTitle("APD ratio map; z / mm; x / mm; ");
TGraph2D *dz = new TGraph2D();
dz->SetTitle("APD ratio relative to mean; z / mm; x / mm; ");
Int_t angles[]={-180, -179, -178, -177, -176, -175, -174, -173, -172, -171, -170, -169, -168, -167, -166, -165, -164, -163, -162, -161, -160, -159, -158, -157, -156, -155, -154, -153, -152, -151, -150, -149, -148, -147, -146, -145, -144, -143, -142, -141, -140, -139, -138, -137, -136, -135, -134, -133, -132, -131, -130, -129, -128, -127, -126, -125, -124, -123, -122, -121, -120, -119, -118, -117, -116, -115, -114, -113, -112, -111, -110, -109, -108, -107, -106, -105, -104, -103 -102, -101, -100, -99, -98, -97, -96, -95, -94, -93, -92, -91, -90, -89, -88, -87, -86, -85, -84, -83, -82, -81 -80, -79, -78, -77, -76, -75, -74, -73, -72, -71, -70, -69, -68, -67, -66, -65, -64, -63, -62, -61, -60, -59, -58, -57, -56, -55, -54, -53, -52, -51, -50, -49, -48, -47, -46, -45, -44, -43, -42, -41, -40, -39, -38, -37, -36, -35, -34, -33, -32, -31, -30, -29, -28, -27, -26, -25, -24, -23, -22, -21, -20, -19, -18, -17, -16, -15, -14, -13, -12, -11, -10 -9, -8, -7, -6, -5, -4, -3, -2, -1, 0, 1, 2, 3, 4, 5, 6, 7, 8, 9, 10, 11, 12, 13, 14, 15, 16, 17, 18, 19, 20, 21, 22, 23, 24, 25, 26, 27, 28, 29, 30, 31, 32, 33, 34, 35, 36, 37, 38, 39, 40, 41, 42, 43, 44, 45, 46, 47, 48, 49, 50, 51, 52, 53, 54, 55, 56, 57, 58, 59, 60, 61, 62, 63, 64, 65, 66, 67, 68, 69, 70, 71, 72, 73, 74, 75, 76, 77, 78, 79, 80, 81, 82, 83, 84, 85, 86, 87, 88, 89, 90, 91, 92, 93, 94, 95, 96, 97, 98, 99, 100, 101, 102, 103, 104, 105, 106, 107, 108, 109, 110, 111, 112, 113, 114, 115, 116, 117, 118, 119, 120, 121, 122, 123, 124, 125, 126, 127, 128, 129, 130, 131, 132, 133, 134, 135, 136, 137, 138, 139, 140, 141, 142, 143, 144, 145, 146, 147, 148, 149, 150, 151, 152, 153, 154, 155, 156, 157, 158, 159, 160, 161, 162, 163, 164, 165, 166, 167, 168, 169, 170, 171, 172, 173, 174, 175, 176, 177, 178, 179, 180};
Double_t APD_first={ 5244, 5171, 5124, 5160, 5169, 5255, 5034, 5324, 5277, 5217, 5268, 5295, 5326, 5484, 5324, 5449, 5418, 5531, 5715, 5609, 5484, 5678, 5635, 5457, 5611, 5737, 5601, 5760, 5582, 5608, 5846, 5786, 5784, 5957, 5898, 5844, 5828, 5882, 5980, 6002, 6056, 5922, 5979, 6042, 5960, 5990, 6009, 5950, 6075, 5965, 5973, 5838, 5949, 5868, 5726, 5748, 5617, 5671, 5685, 5621, 5454, 5701, 5606, 5546, 5550, 5466, 5474, 5426, 5343, 5395, 5395, 5343, 5327, 5320, 5227, 5247, 5276, 5254, 5373, 5310, 5245, 5082, 4970, 5033, 4980, 5033, 5001, 4928, 5168, 4972, 5113, 5018, 5128, 5109, 5108, 5096, 5082, 5094, 5073, 5099, 4966, 4999, 4946, 5046, 5030, 4957, 4924, 4970, 4937, 4998, 4939, 4959, 4951, 4953, 4940, 5093, 4961, 4935, 4990, 4998, 4938, 4958, 4974, 4990, 5001, 5013, 5077, 4968, 4896, 4960, 5024, 4964, 4852, 5069, 4959, 5047, 4999, 4957, 5145, 5095, 5056, 5212, 5153, 5139, 5125, 4981, 5116, 4994, 4997, 5059, 5104, 5133, 4954, 5054, 5132, 5071, 5049, 5057, 5367, 5143, 5150, 5207, 5149, 5270, 5181, 5251 ,5160, 5180, 5231, 5277, 5227, 5259, 5275, 5127, 5200, 5206, 5252, 5250, 5211, 5343, 5330, 5438, 5402, 5389, 5426, 5534, 5431, 5592, 5650, 5630, 5680, 5669, 5664, 5696, 5643, 5862, 5674, 5923, 5721, 5804, 5890, 5925, 6021, 6075, 6075, 6058, 6128, 6723, 6244, 6099, 6202, 6086, 6240, 6245, 6122, 6257, 6102, 6068, 6176, 6311, 6311, 6154, 6331, 6212, 6238, 6231, 6237, 6181, 6187, 6176, 6167, 6119, 6319, 6321, 6298, 6318, 6380, 6306, 6330, 6413, 6330, 6435, 6377, 6419, 6503, 6561, 6426, 6376, 6311, 6461, 6440, 6466, 6393, 6435, 6503, 6403, 6390, 6361, 6444, 6319, 6278, 6235, 6313, 6238, 6282, 6344, 6255, 6311, 6208, 6236, 6194, 6284, 6287, 6362, 6281, 6332, 6237, 6345, 6203, 6422, 6409, 6365, 6383, 6439, 6440, 6383, 6298, 6374, 6450, 6356, 6450, 6343, 6326, 6357, 6427, 6470, 6366, 6296, 6160, 6408, 6227, 6173, 6156, 6261, 6043, 6282, 6209, 6136, 6147, 6106, 6113, 5998, 6006, 6002, 5894, 5877, 5847, 5825, 5784, 5825, 5840, 5819, 5826, 5806, 5837, 5715, 5749, 5765, 5553, 5598, 5614, 5519, 5547, 5658, 5635, 5577, 5454, 5410, 5524, 5432, 5388, 5342, 5390, 5563, 5281, 5240, 5283, 5257, 5158, 5097, 5220, 5148, 5192, 5133, 5203, 5176, 5238, 5123, 5210, 5126, 5234};
Double_t APD_second={ 4795, 4854, 4830, 4928, 4825, 4791, 4866, 4803, 4898, 4925, 4904, 4931, 5020, 5009, 5125, 5010, 5068, 5114, 5043, 5031, 5150, 5026, 5073, 5114, 5028, 5197, 5284, 5099, 5202, 5227, 5270, 5213, 5248, 5179, 5138, 5228, 5121, 5198, 5009, 5165, 5258, 5151, 5242, 5329, 5370, 5207, 5252, 5362, 5375, 5447, 5475, 5396, 5517, 5400, 5444, 5363, 5432, 5337, 5470, 5307, 5292, 5413, 5451, 5326, 5370, 5413, 5411, 5299, 5389, 5337, 5475, 5436, 5421, 5492, 5352, 5415, 5378, 5317, 5242, 5361, 5374, 5279, 5301, 5223, 5195, 5121, 5185, 5266, 5141, 5112, 5092, 5244, 5229, 5155, 5180, 5209, 5133, 5151, 5166, 5077, 5021, 4998, 5013, 5005, 4914, 5011, 4857, 4862, 4828, 4757, 4840, 4872, 4790, 4835, 4770, 4734, 4827, 4742, 4774, 4718, 4741, 4843, 4727, 4564, 4495, 4403, 4449, 4496, 4430, 4450, 4475, 4577, 4479, 4408, 4341, 4420, 4505, 4427, 4426, 4339, 4458, 4431, 4483, 4370, 4473, 4506, 4590, 4550, 4490, 4609, 4579, 4643, 4537, 4670, 4653, 4799, 4557, 4781, 4633, 4845, 4764, 4837, 4887, 4902, 4826, 5001, 4973, 5079, 4901, 4867, 4791, 4939, 4965, 4895, 4819, 4996, 4874, 4919, 4965, 4907, 5008, 5101, 5217, 5029, 5009, 5074, 5132, 5056, 5165, 5104, 5196, 5280, 5295, 5271, 5383, 5277, 5345, 5421, 5505, 5623, 5637, 5593, 5625, 5606, 5757, 5547, 5723, 5634, 5699, 5848, 5907, 5735, 5858, 5836, 5884, 5722, 5695, 5770, 5647, 5694, 5694, 5837, 5869, 5942, 5819, 5857, 5835, 5844, 5783, 5904, 5930, 6025, 5772, 6020, 6113, 6048, 6019, 6137, 6207, 6268, 6182, 6203, 6194, 6231, 6231, 6234, 6251, 6236, 6175, 6101, 6204, 6156, 6194, 6177, 6075, 6202, 6273, 6201, 6213, 6234, 6299, 6158, 6281, 6140, 6117, 6213, 6131, 6180, 6076, 6139, 6066, 6169, 6063, 6030, 6017, 6100, 6136, 6144, 6102, 6199, 6107, 6154, 6108, 6157, 6102, 6170, 6069, 6001, 6129, 6063, 6118, 6155, 6170, 6078, 6154, 6018, 6005, 5931, 5950, 5888, 5886, 5902, 5877, 5852, 5924, 5863, 5766, 5754, 5777, 5740, 5684, 5687, 5663, 5553, 5610, 5568, 5556, 5602, 5543, 5530, 5662, 5737, 5436, 5544, 5464, 5405,
5318, 5359, 5146, 5212, 5240, 5218, 5259, 5218, 5146, 5031, 5131, 5121, 5203, 5217, 5121, 5116, 4961, 4946, 5102, 5071, 5038, 4970, 4893, 4897, 4819, 4811, 4894, 4921, 4875, 4780, 4844, 4836, 4843, 4815, 4790};
c->cd(1);
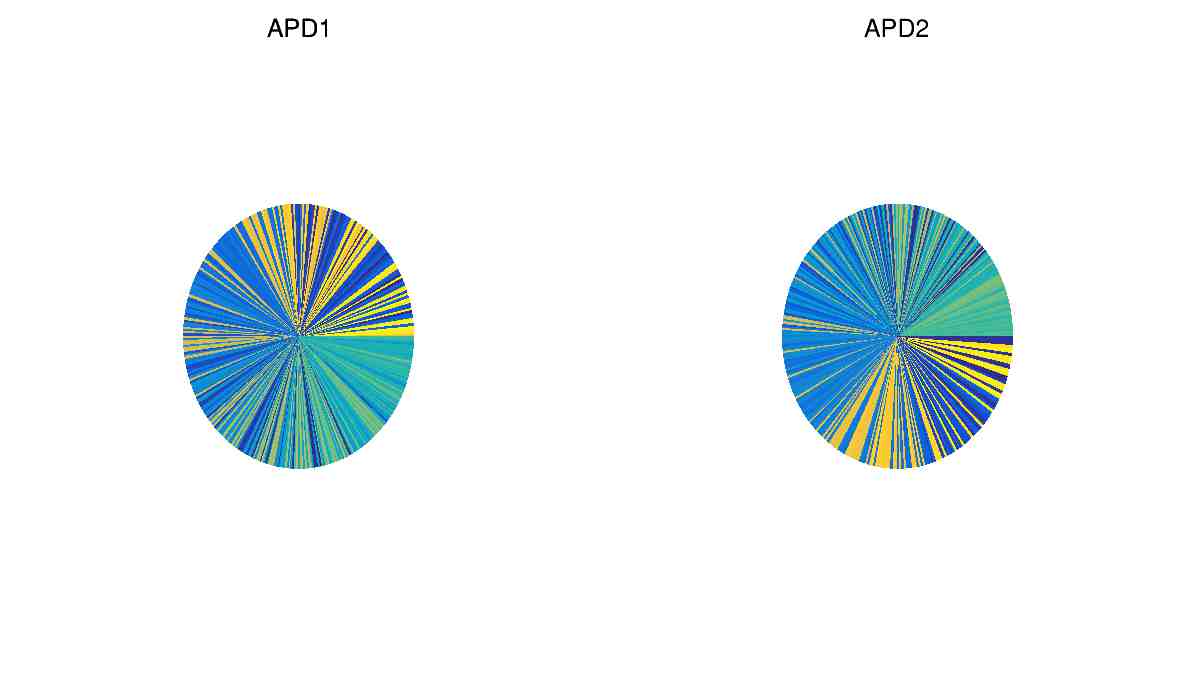
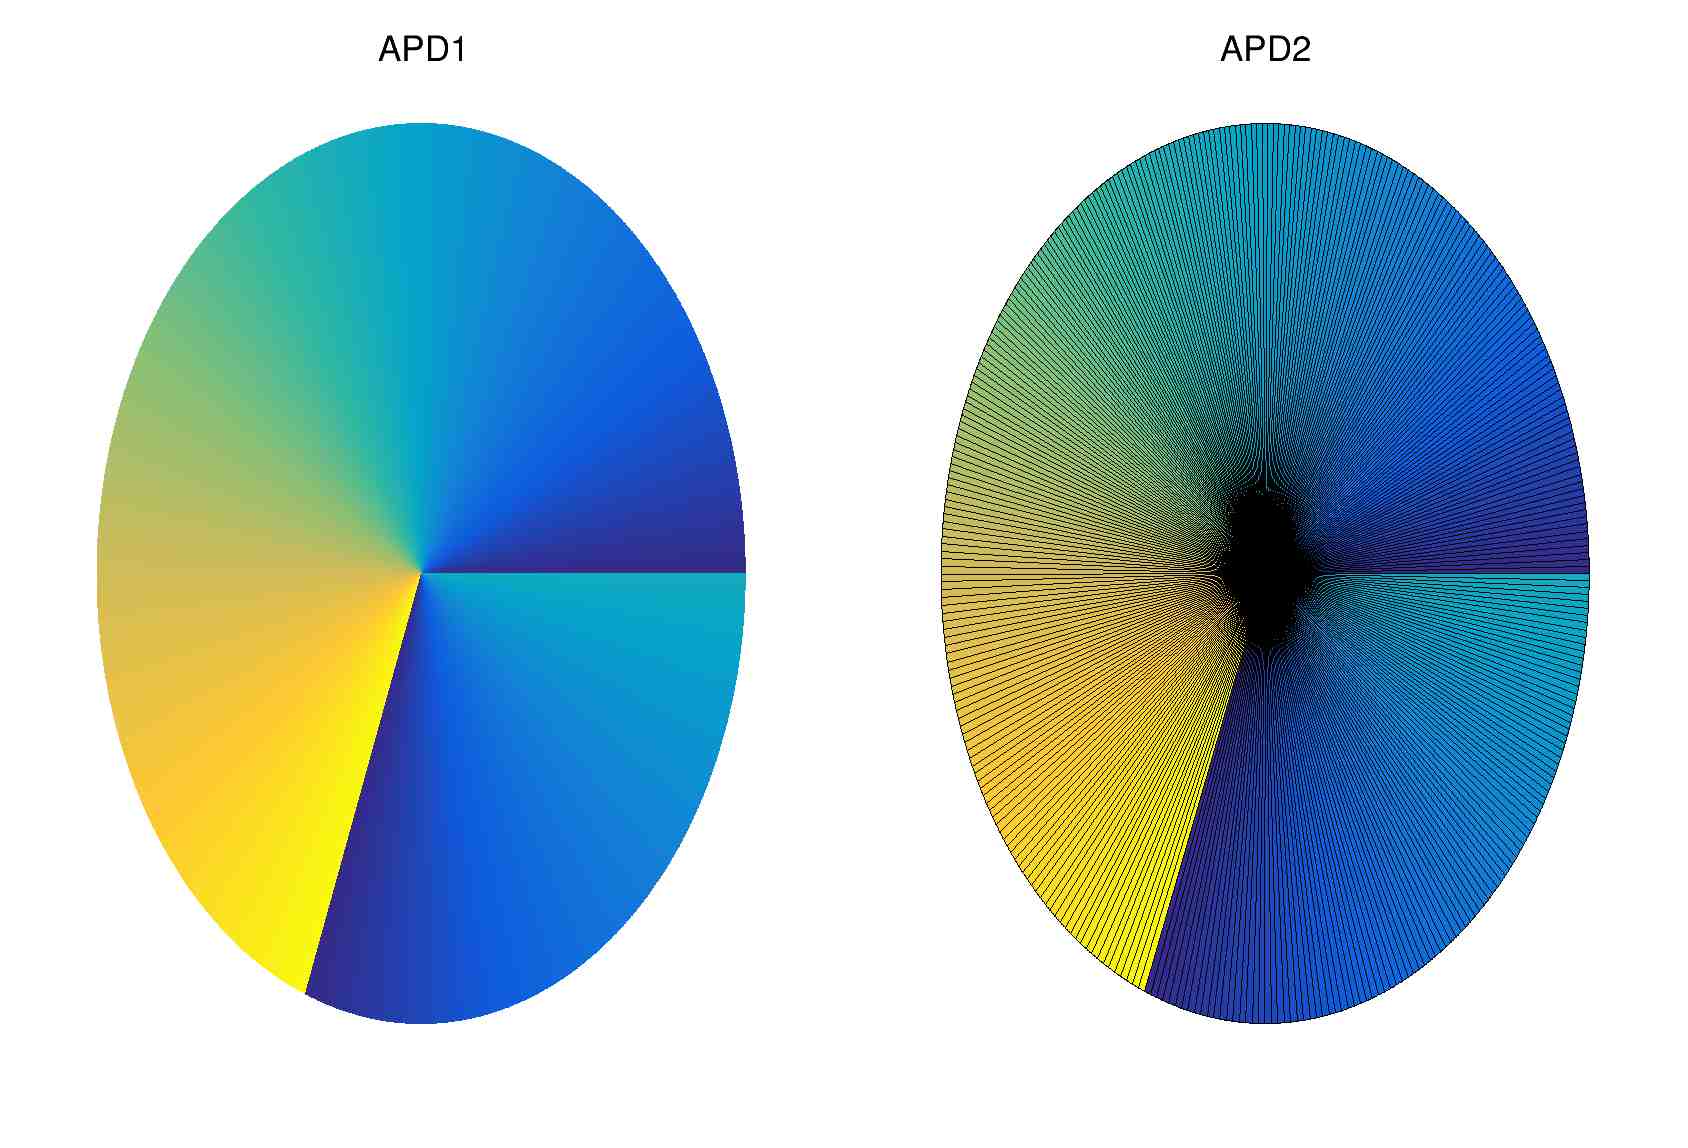
TPie *pie4 = new TPie(“APD1”, “APD1”, 361, APD_first);
pie4->SetRadius(.4);
// pie4->SetLabelsOffset(.01);
pie4->SetLabelFormat(“”);
pie4->Draw(“colz”);
c->cd(2);
TPie *pie5 = new TPie(“APD2”, “APD2”, 361, APD_second);
pie5->SetRadius(.4);
// pie5->SetLabelsOffset(.01);
pie5->SetLabelFormat(“”);
pie5->Draw(“colz”);
return 0;
}