I got it working but it is just not really visualizing the content:
As far as I can see ROOT is not able to visualize how I would like to. I found something I’m looking for in R:
http://www.r-graph-gallery.com/wp-content/uploads/2015/10/49_custom_pie_plot.png
couet
August 27, 2018, 10:48am
22
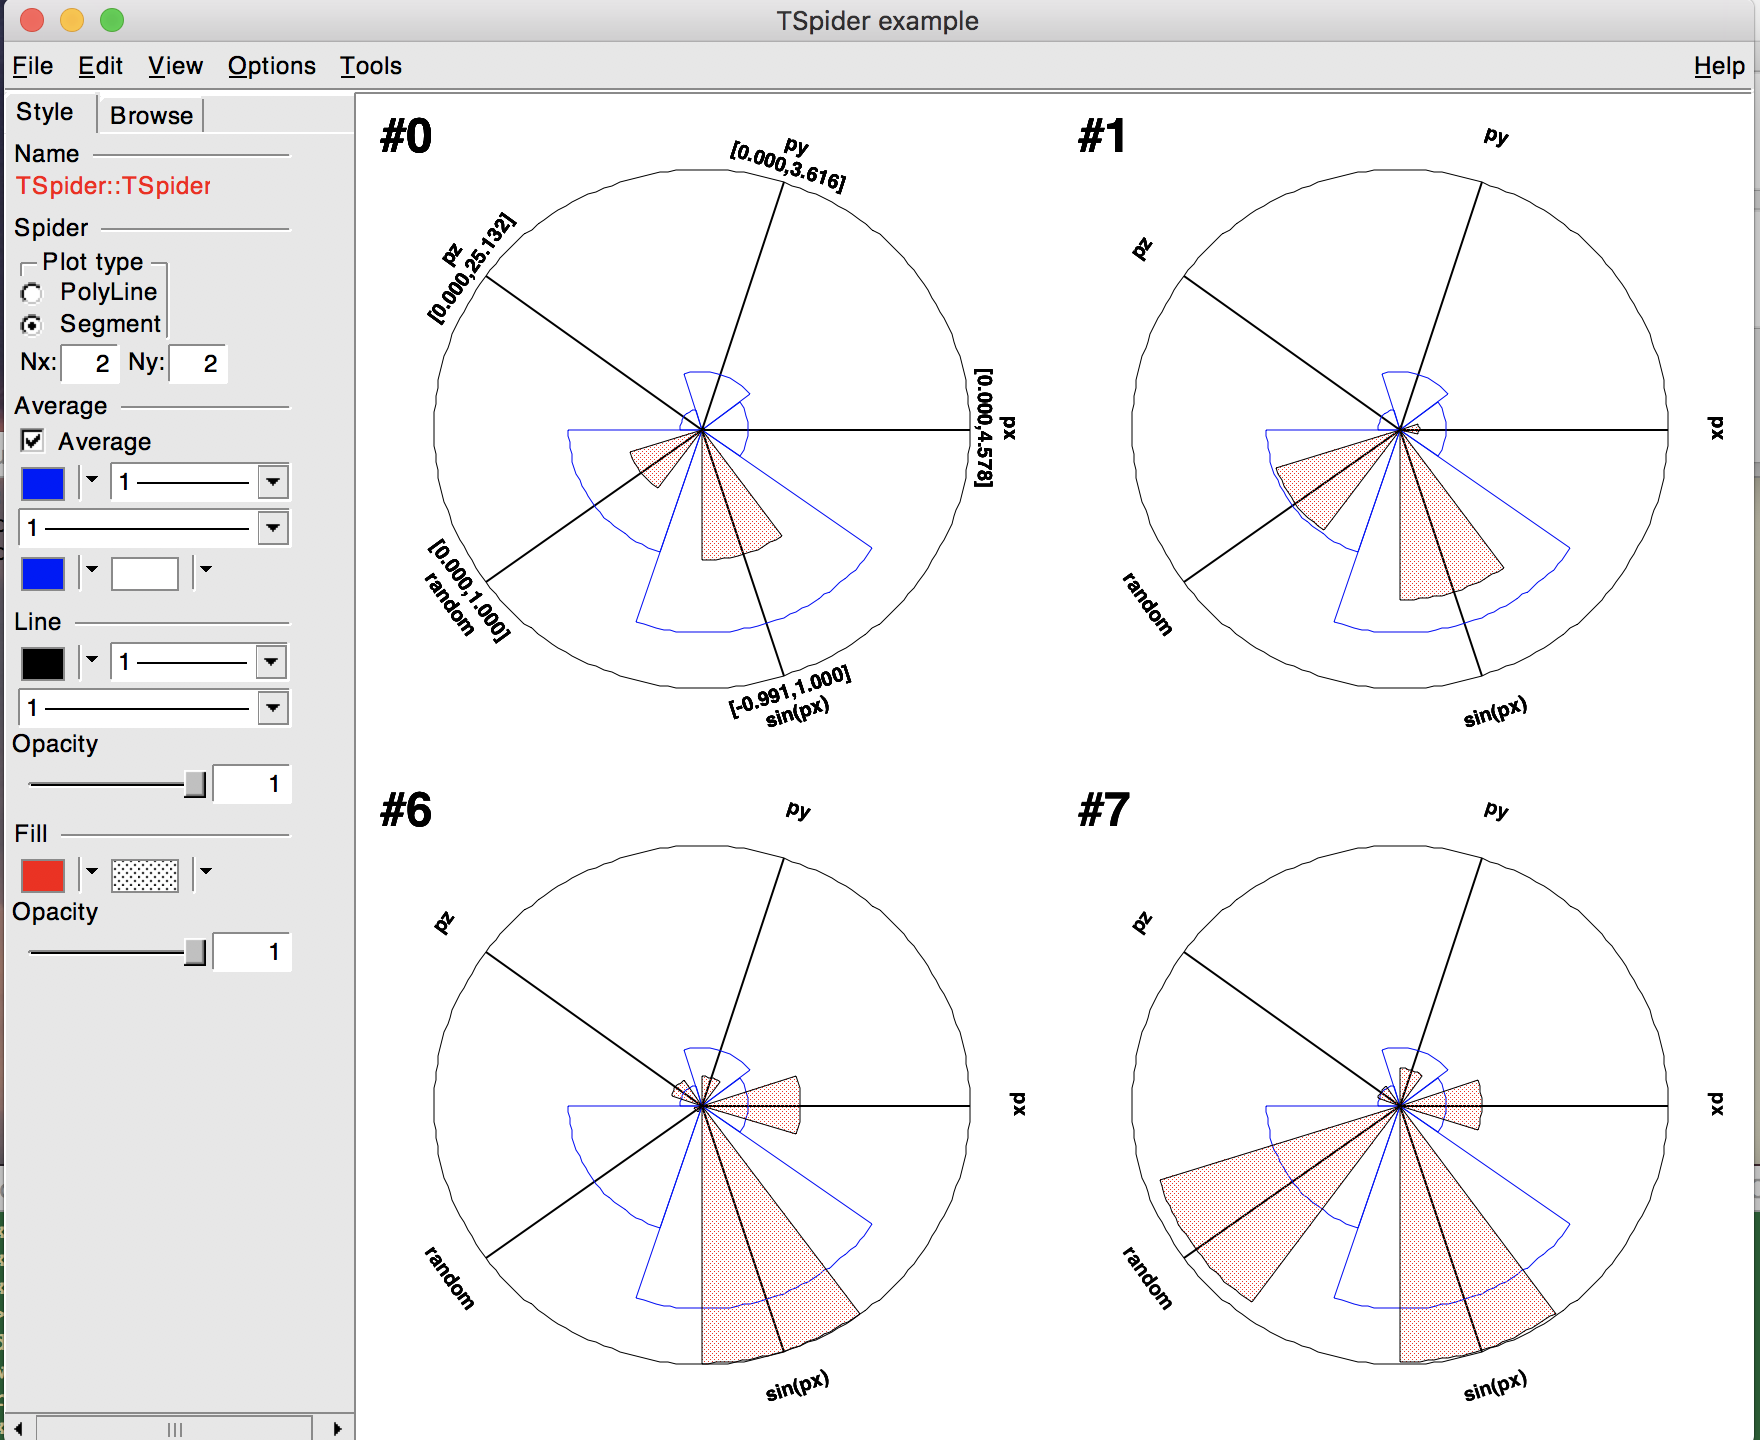
You are right, ROOT does not provide this kind of representation. It can be done using TArc but it is not provided as a “ready to use” option.
couet
August 27, 2018, 11:39am
23
There is something similar with the spider plot. But you will miss the colors I guess.
It seems to me that any “pie / spider plot” makes sense only if the number of bins is between several and several tens (i.e. it makes no sense if you have several hundred bins).