Weird canvas behaviour

Hi all,
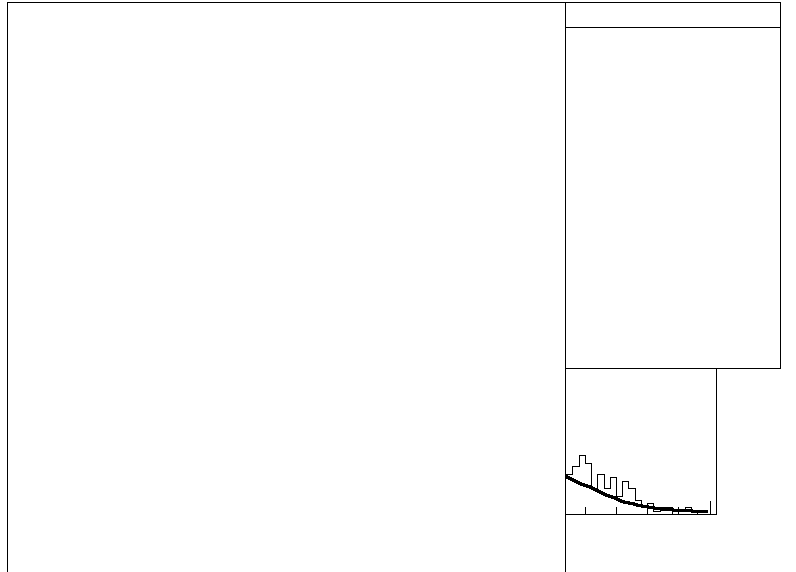
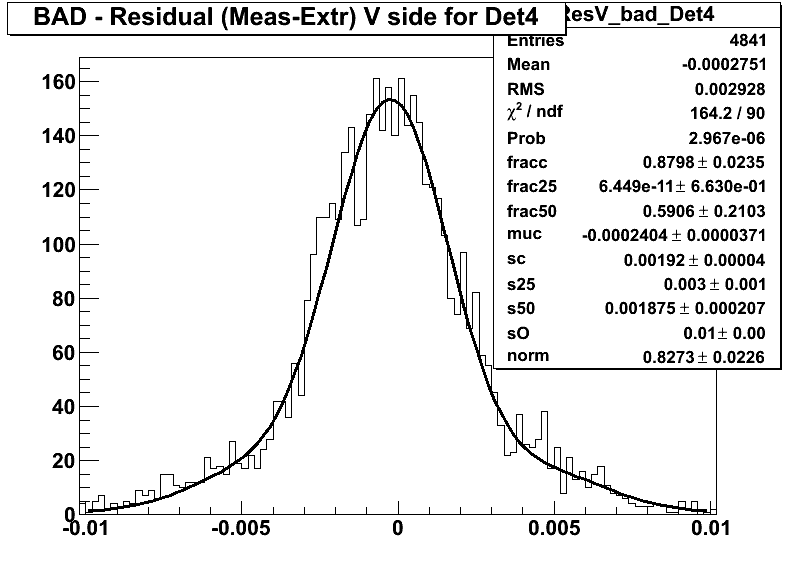
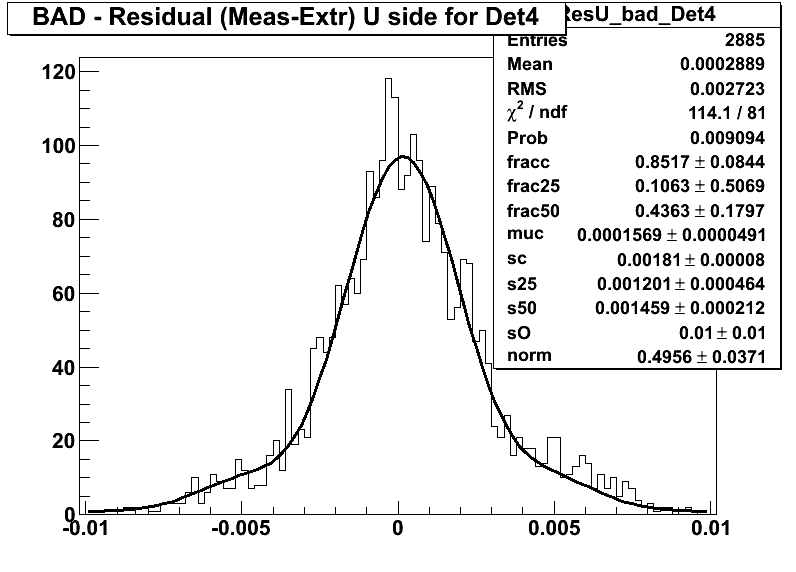
I get the weird plot in the attached [quote]BAD_ResU_Run3743.png[/quote] png figure when I run the [quote]bad_res.c[/quote] attached macro.

This is the rootlogon I use:

{
  std::cout << "Welcome to Root!\n";
  gROOT->SetStyle("Plain");
}

This is the .rootrc

# Path used by dynamic loader to find shared libraries
Unix.*.Root.DynamicPath: .:~/rootlibs:$(ROOTSYS)/lib
Unix.*.Root.MacroPath:    .:~/rootmacros:$(ROOTSYS)/macros
# Path where to look for TrueType fonts
Unix.*.Root.UseTTFonts:     true
Unix.*.Root.TTFontPath:
# Activate memory statistics
Rint.Root.MemStat:       1
Rint.Load:               rootalias.C
Rint.Logon:              rootlogon.C
Rint.Logoff:             rootlogoff.C
Rint.Canvas.MoveOpaque: false
Rint.Canvas.HighLightColor: 5

I’m getting the same weird behaviour here: [quote]alignment/alignment_0_Run3787.ps[/quote] (attached ps file).
This is from another program run in the same environment:
root 5.22 compiled on a Linux box (ubuntu 8.04), g++ 4.2.4.

Help will be much appreciated since I have no clue what’s wrong here.

Many thanks in advance,
Marco
alignment_0_Run3787.ps (159 KB)
bad_res.c (3.44 KB)


Can you provide a macro we can run ? The one you sent depends on external files.

Sorry about that.

Here we go with a standalone macro (no need for extra directories) and the root file with the histograms.

Just run it as:

At the end you will get 2 png files

with the weird aspect.

Many thanks,
Marco
Sbt_Run3743_resout.root (71.4 KB)
standalone_bad_res.c (3.43 KB)

With you macro, using the last ROOT version I get the two attached pictures.


I see… Is it possible that what I see is related to .rootrc and rootlogon.C?

I attached those in first post.

Thanks,
Marco

no, … I ran your rootlogon.C and I get the same images.
I guess it is more a matter of root version.

Hi,
today I installed root 5.24. Unfortunately the problem is still there.

Any suggestion?

Many thanks in advance.

Regards,
Marco

if you run without the rootlogon.C (root -n) is it the same ?
I do not have any ubuntu machine here to test …

Hi,
I run it this way:

but I get the same weird result.

Marco

I see you run in batch. I was not running in batch. Can you try without the option “-b” ?

Ok, not running in batch makes plots look ok.

But, as I already said, I do have same problem for a compiled program.
How can I fix the problem in that case?

Many thanks and regards,
Marco