Apologies if the title is unclear, or if this is in the wrong forum section.
I’m trying to use Sumw2 on three different histograms, and plot all of them on the same canvas, with a line drawn between each set of the points. However, I’ve only been able to either have a line through only one set of data, and error bars on all of them, or lines through all data sets and no error bars.
I’ve tried different variations of “hist”, “same”, “sames” etc, but I can’t seem to get a winning combination.
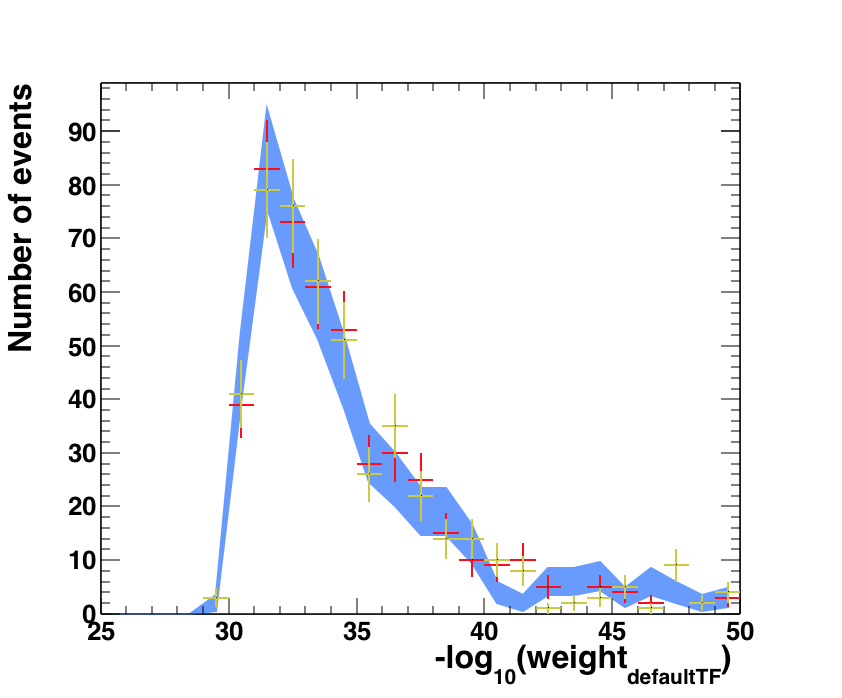
The above code will produce something similar to the attached image. (Colours / Line style may be slightly different, that’s the only version I can find at the moment, sorry). I can attach the full code too if you like, although it currently reads in a number of files before it plots the data - might be a bit much to attach all of it. ttH_TFcomparison_weights.eps (29.1 KB)
I’ve attached the full code, the plotting part (and in particular, the comparative plot) is what I need help with. But like I said before, this code reads in 9 different files to run, so it won’t run properly unless I attach them all (which I can do if you’d like, but I’m not sure if I’d be breaking a forum upload rule or something). create_2500ev_weightratio_050415_pls.C (18.1 KB)
First of all you draw twice the same histogram (histogram_default) with different options. That does not work… You how use DrawClone for the 2nd drawing. Let’s imagine that’s the case. Then you should see histogram_default drawn with option E3 and then 3 histograms on top of it drawn with the default drawing option. Which is a bar chart if the histogram has no built in errors, or errors bars if its has built-in errors. I am afraid I cannot help you further without a small example reproducing the issue.
Thanks for the reply. I’ve attempted to attach the relevant files for the code, but when I try to upload, I’m told the extensions .lhco and .out are not allowed.
which gives the same as result2. I’m basically looking for result1 with error bars, is that at all possible? result2.eps (10.5 KB) result1.eps (9.38 KB)
Unfortunately that code fails to draw a contour through any of the points (the result’s attached below). Appreciate the help though. result3.eps (15.1 KB)