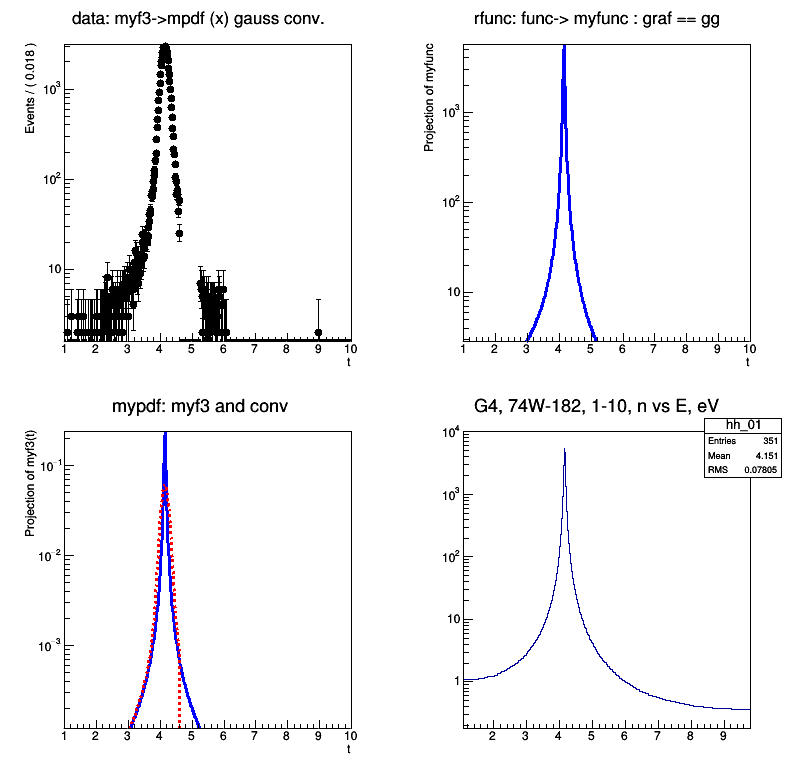
plot of the input data is very strange - histogram reproduce
data - 4-th gpad, but function in RooFit has strange shape for
these data - 2-ns gpad
I started to use RooNumConvPdf for simple input function -
myf3() - BW and gauss() - this time convolution works
(unlike of FFT method) BUT very strange also -
at the plot - gpad 1 and 3 - there is drop of points at t=4.6 - 5.6
What does it mean !? where is the problem ?
thanks,
Vladimir
Dear Lorenzo,
I am trying to use RooFit methods to get convoluted crosssection
of neutron resonancies. Results:
FFT method does not work for me I do not know why
try NumConvPdf - strange result !
I use ex-myNumConv.C : read input data file : data-1-10.txt
(in fact I read full data: but it is too big, so use short variant)
I draw 4 wimdows:
w-1: data simulation using convolution fxg - you can see
a lot of missing regions
w-2: draw data-function which I used for convolution ->
(in other words - it is data, which I read)
you see that plot shows values ONLY in the region 3-5 eV
–> compare this with full data sample at the w-4 !
w-3: here I draw result of convolution :
BLUE - initial BW resonance (the same as at w-2)
RED - result of numeric convolution : cut at E= 4.6 eV !
so, questions : is it problem with plot procedure !?
OR is it problem with RooFit methods ?
OR it is my error --> where and what ?!
 2 topics are here :
            1) w-2 and w-4 :  why plot does not reproduce input data ?
	2) I use simple variant:
	    take BW resonance and gauss - as it is from examples
	                                  at Internet
	    - w-1  data sample using this convolution (fxg)
	    - w-3  convolution  fxg - you see cuts in region
              (it is the same problem, when I use my input data)
thank you,
Vladimir, my mail adress: babintsev@ihep.ru (Protvino, RUSSIA)
Thank you Vladmir for the explanations. I will have a look, but it will take me same time, since it is not an easy answer.
Is this then a duplicate of RooFit import histogram plot ?
… thank you, there are some modifications from
previous one : I worked with my own data,
and the last picture : using simple BW and Gauss
as a part of the question…