FeldmanCousins.C macro calculates upper limit on signal yield using the Feldman-Cousins approach. This follows the paper PRD V57 #7, p3873-3889. But this macro doesn’t take care of systematic uncertainty.
Is it possible for someone to include systematic uncertainty in upper limit estimation using this FeldmanCousins.C macro? There is a paper PHYSICAL REVIEW D 67, 012002 2003 that describes the upper limit by Feldman-Cousins approach including systematic uncertainty on background yield also.
Can anyone please change the existing FeldmanCousins.C macro or explain any other idea to estimate the upper-limit which takes care of the systematic uncertainty also in case of low statistics events?
The macro uses the TFeldmanCousins class which implements the FC procedure in the simple number counting case without systematics.
In RooStats it is possible to compute the FC limit for a generic case for any model including systematic uncertainty. You would need in this case to describe your model using RooFit.
Thank You for giving such important information. I am going through the StandardHypoTestInvDemo.C macro. The macro is quite lengthy. I am trying to understand this.
Can you let me know what is the input information need to be given from the user to this macro? As I have mentioned the requirement is for low statistics and there are no observed events found in the signal region. So it’s difficult to make a fitting PDF in roofit.
you need to provide a RooFit workspace describing your model (e.g. in your case a number counting experiment) and name of the signal+background model present in the workspace, name of the data set and then some configuration parameters.
For using the callculator as Feldman-Cousins you need to provide:
calculatorType = 0 (Frequentist calculator)
testStatType = 2 . Type of test statistics is the Profile likelihood - double side. This is what the FC method uses , as described in the original paper
useCLs = false . We are not using the CLs method to correct the p-values by dividing CL(S+B) by CL(B)
npoints = 10 . Number of points to sacn you can set to a reasanable value. If you need you can increase it
min, max values of the parameter to scan
useNumberCounting = true if you are using a number counting experiment , as I think is in your case.
In that case ig you have 0 events observed you should pass nobs=0 to the macro and the correct values of background and its uncertainty. An Gaussian uncertainty of the background is assumed, if you have a different one, you should model accordingly and modify that macro
I hope this helps, if you have further questions, please let me know
Thank You so much for the explanation! I have a created model by nobs =0, b =1 and sigmab=0.2. And nothing else is changed in the solution code for creating the model. Then StandardHypoTestInvDemo.C is executed as: “StandardHypoTestInvDemo(“CountingModel.root”, “w”, “ModelConfig”, “”, “data”, 0, 2, false, 10, 0, 100, 1000, true)”. Here tested for 1000 Toys. Then following results I get at the end with two plots.
The computed lower limit is: 0.0383142 +/- 0.278635
The computed upper limit is: 6.66667 +/- 0.526025
Expected upper limits, using the B (alternate) model :
expected limit (median) 4.04762
expected limit (-1 sig) 1.66667
expected limit (+1 sig) 5.83333
expected limit (-2 sig) 0.127507
expected limit (+2 sig) 7.14286
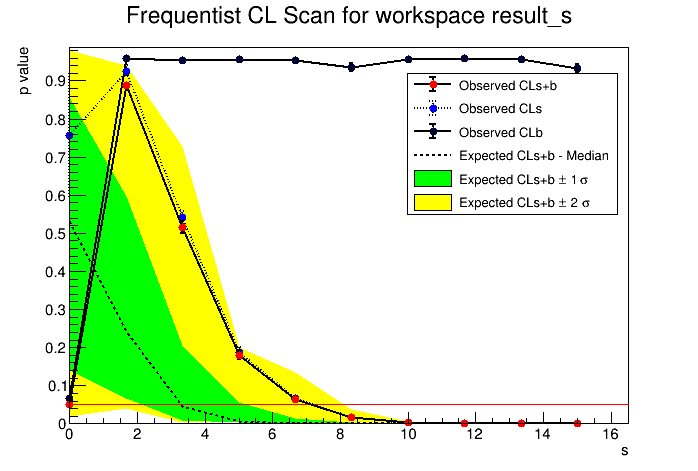
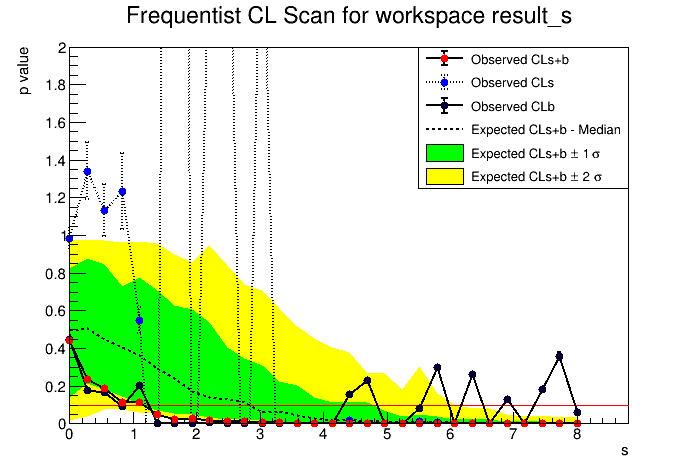
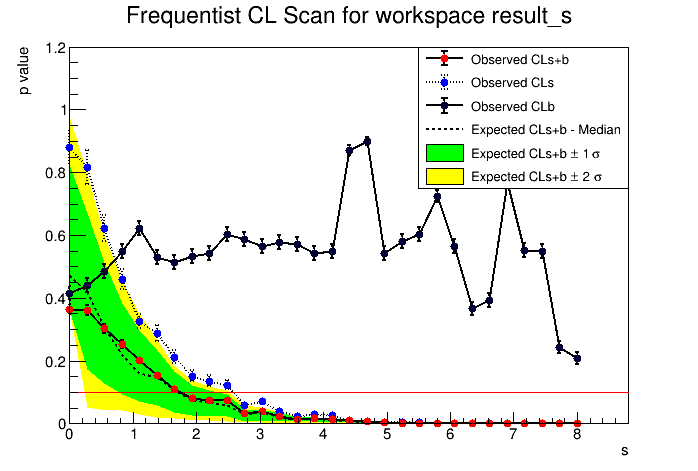
So shall I consider the upper limit as 6.66 or 4.047? The two plots are attached here.
Can you please let me know the meaning of p value vs s plot? Why there is a red horizontal line at the bottom touchng the first red bullet also? Another thing it’s computed with 95% CL. So if need to change to 90 % CL then I am changing the line:
double confidenceLevel = 0.90 (line no. 92) is it fine?
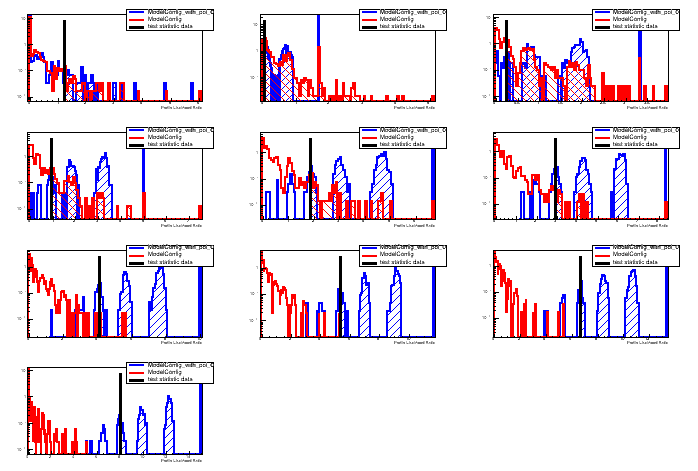
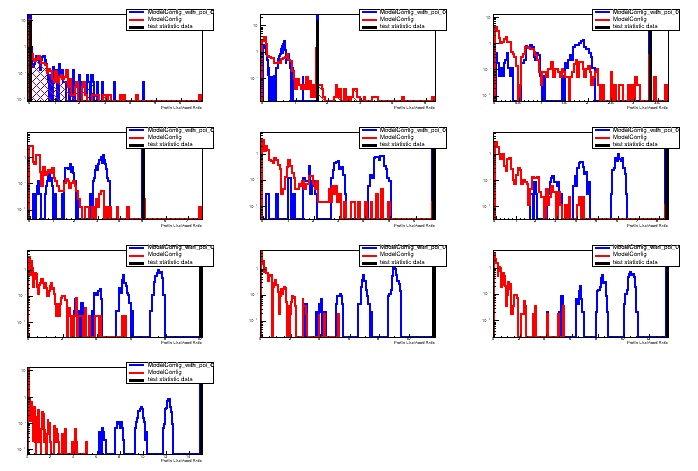
The p-value tells you how many pseudo-experiments have observed value larger than the one observed. You can see in the bottom plots. You have a black line which is the test statistics (profile likelihood ratio) computed on the observed data and the red and blue distributions are the results from the pseudo-experiments. From the red distribution the p-value for S+B (CL(S+B) is computed and from the blue histogram the CL(B).
Now looking at the result it looks to me that you have a best value for s = 2 that is favored (maximum S+B value). This implies that you have a data set where th enumber of observed event is not zero, but probably 3 if B=1. This explains why best S = 2.
Thank You! Now I have changed the model for nobs =0, b=1, sigmab=0.2. The code is attached here.CountingModel.C (1.6 KB) Please check once?
Now the following output I got.
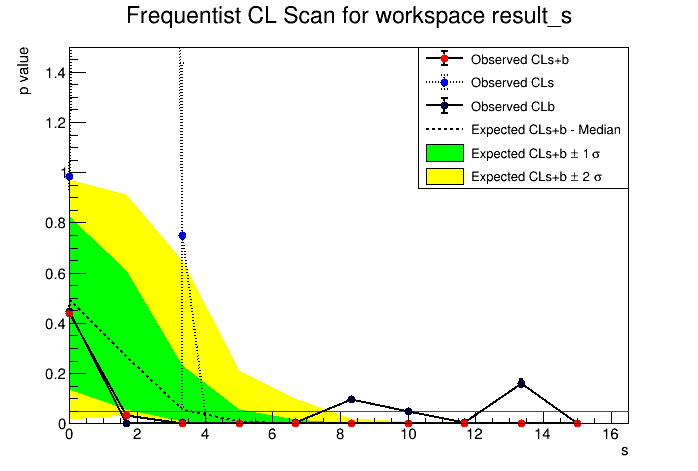
The computed upper limit is: 1.59722 +/- 0.10788
Expected upper limits, using the B (alternate) model :
expected limit (median) 3.60544
expected limit (-1 sig) 1.875
expected limit (+1 sig) 5.27258
expected limit (-2 sig) 0.789474
expected limit (+2 sig) 7.74116
Shall I consider the upper limit on the signal yield as 1.59? Also I think for changing 95% CL to 90% CL need to change in StandardHypoTestInvDemo.C macro.
Hi,
Yes this would be the resulting observed upper limit on s. I would increase the number of points to scan (e.g. 20 or 30) and use a shorter range (e.g. [0,8] ) if you are just intrested in the upper limit.
For changing the confidence level do as following (from the ROOT prompt)
.L $ROOTSYS/tutorials/roostats/StandardHypoTestInvDemo.C
optHTInv.confLevel =0.90;   // change CL to 90%
StandardHypoTestInvDemo("CountingModel.root","w","ModelConfig","","data",0,2,false,30,0,8,1000);
Thank You so much! For nobs =0, b=1, sigmab=0.2;
upper limit on signal yield = 1.15 at 90% CL
= 1.37 at 95% CL
The scan plot is attached here with changed range. But why the limit is changing so much from 1.59 to 1.37 at 95% CL by changing the range?
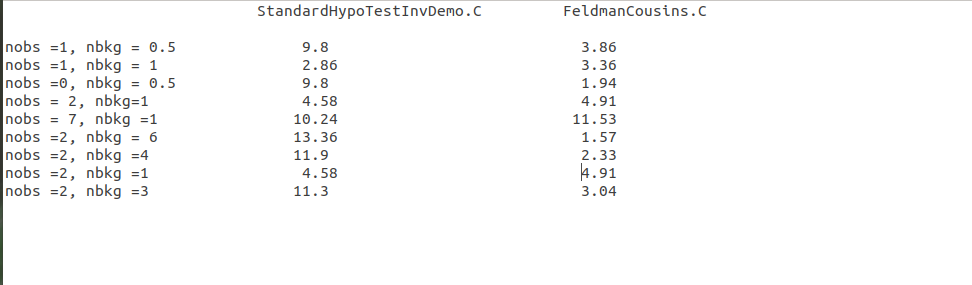
I tested a few sets of nobserved, nbackgrounds between FeldmanCousins.C macro and current roostat StandardHypoTestInvDemo.C macro at 90%CL. I keep the uncertainty on background =0.01 in all cases for roostat . I find that in some cases the UL is matching well between both. But somecases they are varying. Although uncertainty is there in roostat case but it shouldn’t affect much.
Here are some results:
Thank you for producing thus result. I think there are some issues in the procedure (e.g. number of scanned points, etc…) that make the result of RooStats different so much.
I am expecting that adding a small systematic uncertainty (e.g. 0.01) improved the original result because it breaks the discreetness value of the test statistic distribution.
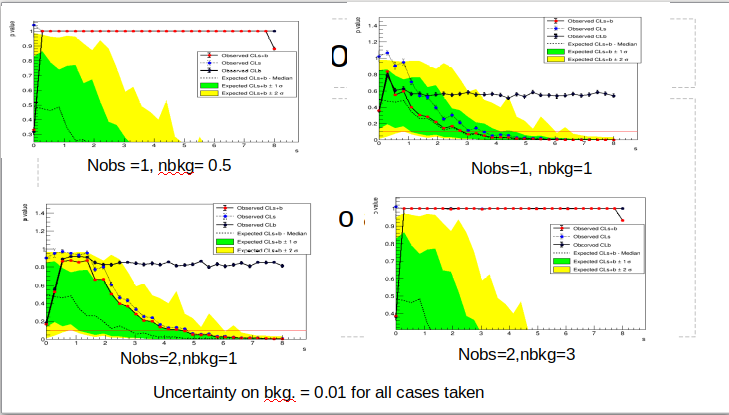
For example the result for (nobs=1, nbkg=1) and (nobs=7,nbkg=1) look fine. But nobs=1,nbbkg=0.5 seems wrong and so the other which are very different. I would check the scan plot in these cases
. The cases like (1,0.5) and (2,3) have something unpleasant scan plots.
The executed code is:
StandardHypoTestInvDemo(“CountingModel_07_05.root”,“w”,“ModelConfig”,"",“data”,0,2,false,30,0,8,1000,true); for all cases. If number of scanned point is the issue then how to give the proper number of scanned ponits for a combination?
HI,
Thank you, I see there is an issue with the (1,0.5) and (2,3) cases. Probably a failing fit when computing the data test statistics. I will investigate it and let you know
Hi,
The problem is in the macro creating the workspace, the initial values of the parameter were not correctly set. I attached the fixed macro, please try that one to create the workspace to provide as input to the macro.
Also in some case you might need to adapt the scan range passing large max value when calling the StandardHypoTestInv macro
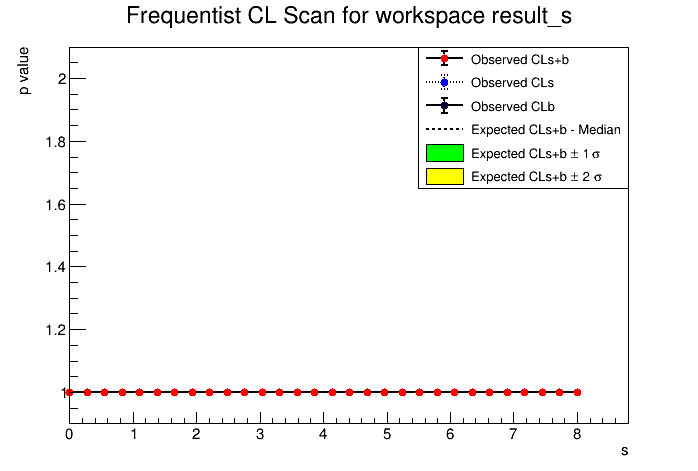
I checked this time for nobs =0, nbackground = 0, uncertainty on background = 0.5 with the above model. Then UL comes 0.15 but this value is not matching to Feldman-Cousins value of 2.44. I also change the uncertainty to other values like 0.2, 0.02 etc but every time 0.15 is the UL at 90% CL. Here I have attached the scan plots.
. I think this test is a worthwhile; suppose for some case there is no background and also no observed events. But there may some uncertainty due to some other sources. Can you please let me know how to proceed for these cases?
Tested with StandardHypoTestInvDemo(“CountingModel.root”,“w”,“ModelConfig”,"",“data”,0,2,false,30,0,8,1000,true); I checked by changing different scan ranges also. But couldn’t find the solution.
There is an issue in the macro creating the model when you set the background to zero. It was using as input a relative uncertainty. I attach now a modified version that requires the absolute uncertainty in the background, and should give you a correct result when background=0
Thank You so much for modifying the macro! Now the UL =1.74 when nobs =0, nbkg =0 and uncertainty =0.5. Whereas from FeldmanCousin.C value without any uncertainty = 2.44 directly. Both value seems to be resonable. The relevant plots are attached here.