Hello everyone!
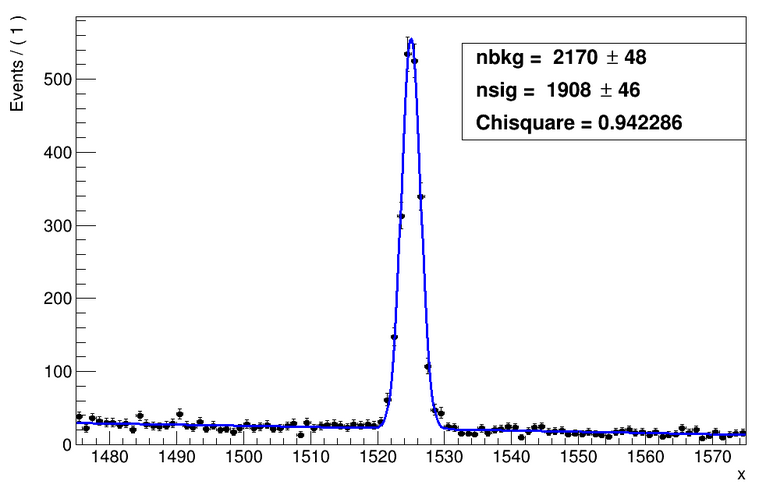
I am trying to extract upper limits on Number of signal events. I have a Gaussian signal over flat background. I fit my data with model:
Model = nsig * gauss + nbkg * bkg(1st order poly)
and my model fits the data very well, you can see below my piece of code and fitted plot.

Then, in order to put upper and lower limits, i used ProfileLikelihoodCalculator macro from roostat and plotted upper and lower limits on 95% CL. The limits i got (lower=1819, Upper=1999) seems reasonable to me but plot “-log λ(nsig) vs. nsig” doesn’t.
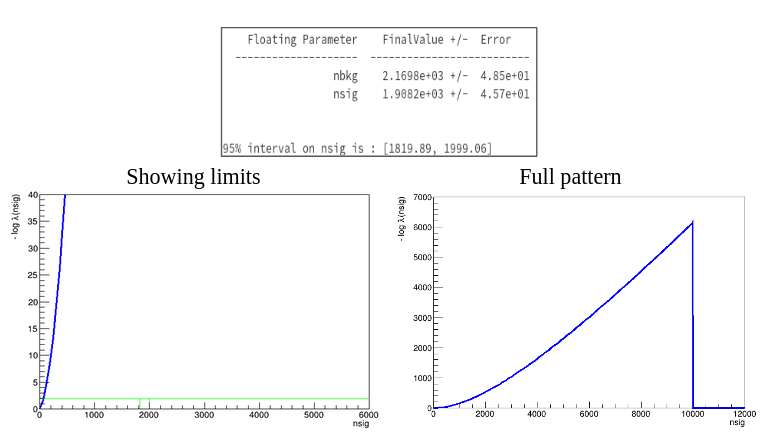
My questions is shouldn’t -logλ(nsig) plot be something like parabola or at-least something passing by the limits?
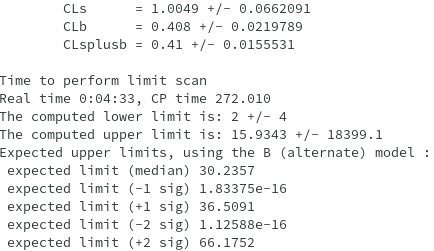
Then i saw a post Upper limit on particle width using ProfileLikelihoodCalculator? where @moneta suggested someone to use StandardHypoTestInvDemo.C insteas of profilelikelihoodCalculator. So i tried that macro for my case by changing:
(a) calculatorType = 0 (Freq calculator)
testStatistics = 2 (profile Likelihood) and i got the limits i.e. (L = 2, U = 15.9) which doesn’t make sense to me.
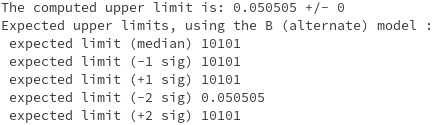
(b) When i used Asymptotic calculator i again got some weird results:
Could someone explains to me please what is going wrong here. I am very new to these roostat stuff and also this HypoTest macro is too long to understand everything in it.
I am sorry for such a long post but that was the only way to explain my problem.
Thank you in advance