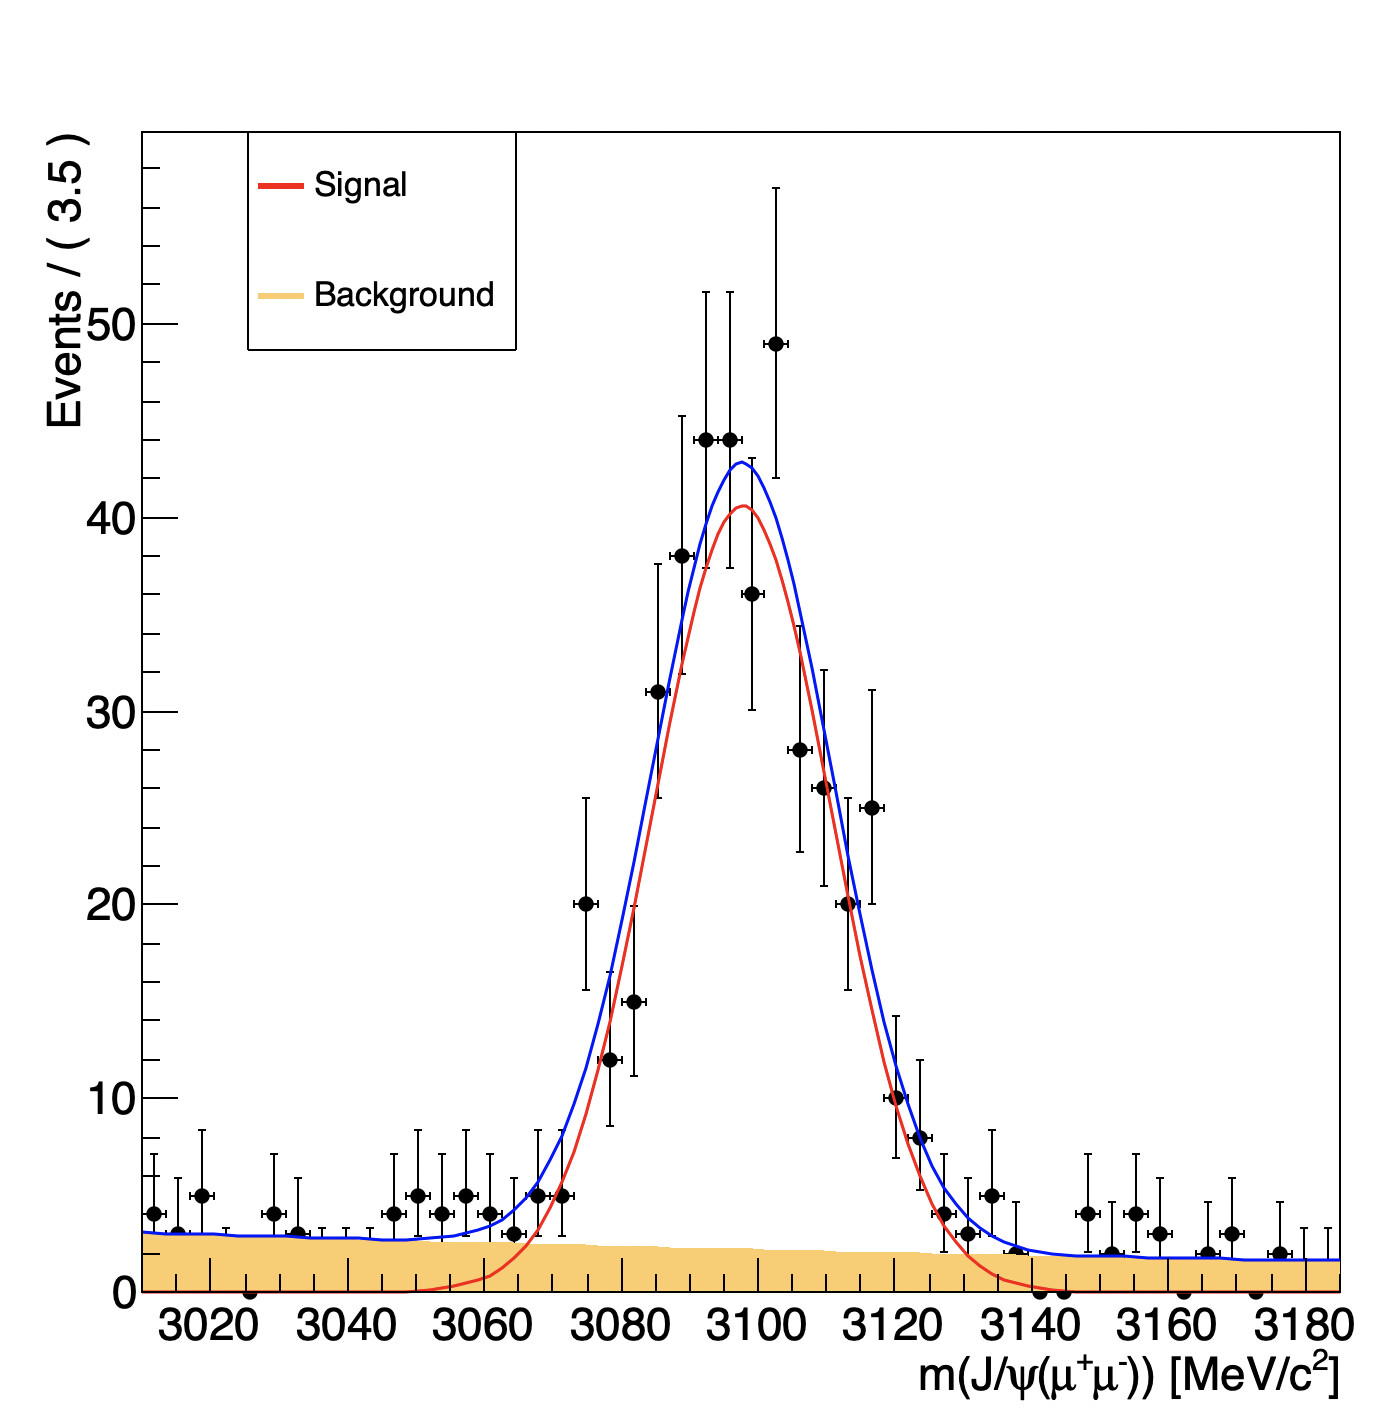
I am plotting the result of a fit which consists of some signal PDF and the exponential background. The latter component is plotted with DrawOption(“F”) to have a filled orange shape:
Instead, only a part of the shape is orange while the rest remains white (see the attached pdf file).
I know various versions of similar issues have been raised/solved here in the past, but nevertheless this problem occurs in 6.24. Am I missing some plotting arguments or is this a bug?
Minimal example attached.
This plot is a RooCurve which is a TGraph. When you draw a TGraph as filled polygon you use the F option described here. Ie: a polygon is drawn by connecting the last and the first point of the graph. That’s what you see. To fill the area below the curve you would need to add extra points. I am not sur this is foreseen by RooCurve. May be @moneta knows.
Thanks for your reply. The documentation however says “If a filled style is selected, also use VLines() to add vertical downward lines at end of curve to ensure proper closure” so presumably that should have taken care of closing the polygon. Which is apparently not the case?