ROOT Version: 6.30/04
Platform: Windows10
Compiler: Precompiled, downloaded from official site
Hello everyone!
I’m trying to do draw a histogram with two axis. I have checked the twoscales example and the TGaxis reference page and I did a simple example.
From the TGaxis reference page:
It should be noted that
funcis not defined in the user’s coordinate space, but in the new TGaxis space. Ifxis the original axis,wthe new axis, andw = f(x)(for example,fis a calibration function converting ADC channelsxto energyw), thenfuncmust be supplied asf^{-1}(w).
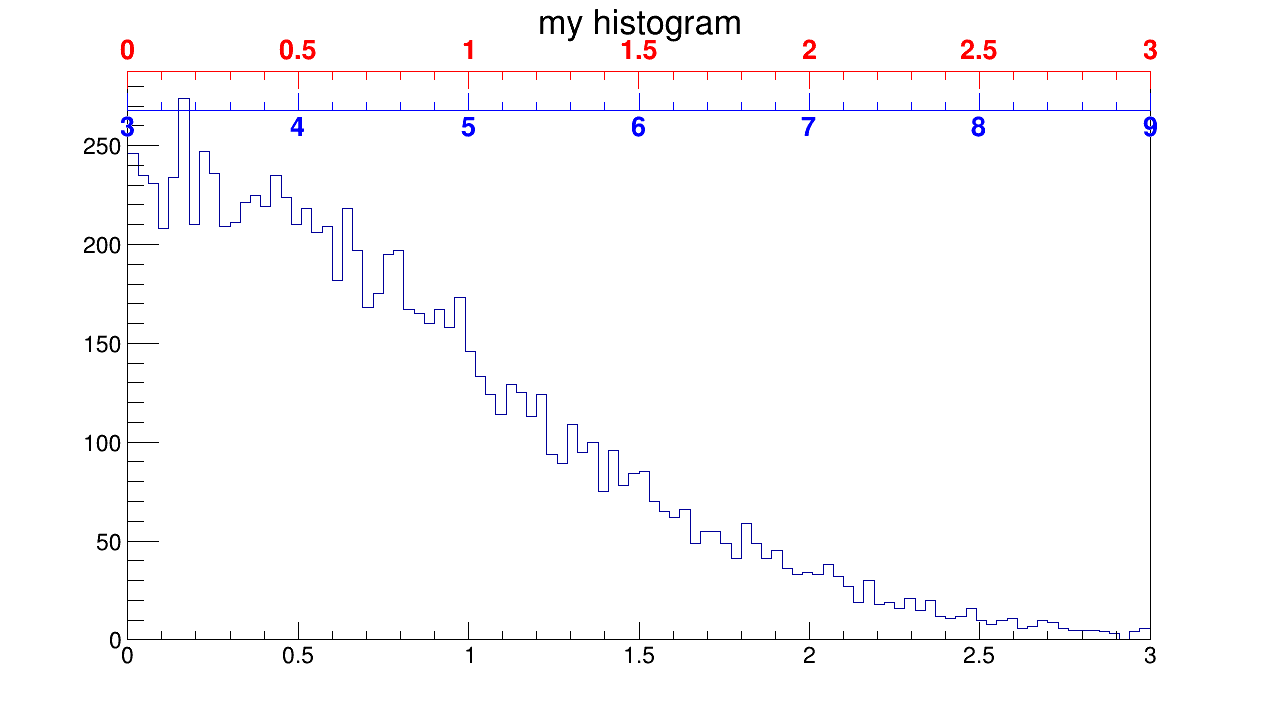
I want to do exactly this, draw my second axis on the top and do a linear scale, so it will be an energy calibrated axis and my original axis on the bottom will contain the ADC channel values.
For simplicity assume that my calibration looks like this: w = 2*x+3 (where x means channel, w means energy) so the func which must be supplied: func = f^{-1}(w)=(w-3)/2
My implementation in the code:
// Linear scaling function
    auto scalingFunction = new TF1("scalingFunction", "(x-[0])/[1]", 0, 3);
    scalingFunction->SetParameter(0, 3);
    scalingFunction->SetParameter(1, 2);
With this scaling on the [0,3] channel range I should get [2*0+3 = 3,2*3+3 = 9] on my red axis on top. However I simply get a [0,3] axis identical to the original (colored red).
I can still achieve my goal if I compute the limits of the desired axis using my scaling function (shown in blue offset from top) so I manually set wmin = 3, wmax = 9.
Did I misunderstand something about the creation of axis using a function? The quoted section about ADC channel to energy conversion suggests this linear function should be usable. I’ve tried to write my linear function directly (x-3)/2 as well, not with [0] & [1] parameters, but that didn’t help either.
I do not really now where is my problem but I noticed that it doesn’t matter which function do I use my limits will remain [0,3] and my tickmarks will scale (I’ve tried the provided examples which use -x, exp(x), log10(x)). But I believe this is not the expected behaviour based on this quote:
Instead of the
wmin,wmaxarguments of the normal definition, the name of aTF1function can be specified. This function will be used to map the user coordinates to the axis values and ticks.
#include "TCanvas.h"
#include "TStyle.h"
#include "TH1.h"
#include "TF1.h"
#include "TGaxis.h"

void axisTest()
{
    TCanvas *c1 = new TCanvas("c1", "histo with different scales", 600, 400);

    // create/fill draw h1
    gStyle->SetOptStat(kFALSE);
    TH1F *h1 = new TH1F("h1", "my histogram", 100, 0, 3);
    h1->FillRandom("gaus", 1e4);
    h1->Draw();
    c1->Update();

    // Linear scaling function
    auto scalingFunction = new TF1("scalingFunction", "pol1", 0, 3);
    scalingFunction->SetParameter(0, 3);
    scalingFunction->SetParameter(1, 2);

    // draw an axis on the top
    TGaxis *axis = new TGaxis(gPad->GetUxmin(), gPad->GetUymax(),
                              gPad->GetUxmax(), gPad->GetUymax(), "scalingFunction", 510, "-L");

    // draw manual axis with manual limits with an offset then color it blue
    TGaxis *axis2 = new TGaxis(gPad->GetUxmin(), gPad->GetUymax()-20,
                               gPad->GetUxmax(), gPad->GetUymax()-20, 1, 4.12, 510, "+L");


    axis->SetLineColor(kRed);
    axis->SetLabelColor(kRed);

    axis2->SetLineColor(kBlue);
    axis2->SetLabelColor(kBlue);

    axis->Draw();
    axis2->Draw();
}
Thank you in advance!