TRatioPlot confidence bands - limiting, asymmetry

_ROOT Version: 6.30/04
Platform: Windows10
Compiler: Precompiled, downloaded from official site


Hello everyone!

I’m trying to better understand the TRatioPlot class. I’m interested in the case of fitting a histogram with a function then constructing the plot. I’ve slightly modified the ratioplot2.C tutorial so I can see the difference between different fits.

My code:

void ratioplot2()
{
   auto h1 = new TH1D("h1", "histoFit", 100, -5, 5);
   h1->FillRandom("gaus", 1e7);
   auto h2 = (TH1 *)h1->Clone();
   auto h3 = (TH1 *)h1->Clone();

   auto pol1 = new TF1("total", "pol1(0)", -2, 2);
   auto pol2 = new TF1("total", "pol2(0)", -2, 2);
   auto gauss = new TF1("total", "gaus(0)", -2, 2);

   h1->Fit(pol1, "OLR");
   auto rp1 = new TRatioPlot(h1);
   h2->Fit(pol2, "OLR");
   auto rp2 = new TRatioPlot(h2);
   h3->Fit(gauss, "OLR");
   auto rp3 = new TRatioPlot(h3);

   auto c1 = new TCanvas("c1", "Fit residuals");
   c1->Divide(3, 1);
   c1->cd(1);
   rp1->Draw();
   c1->cd(2);
   rp2->Draw();
   c1->cd(3);
   rp3->Draw();
}

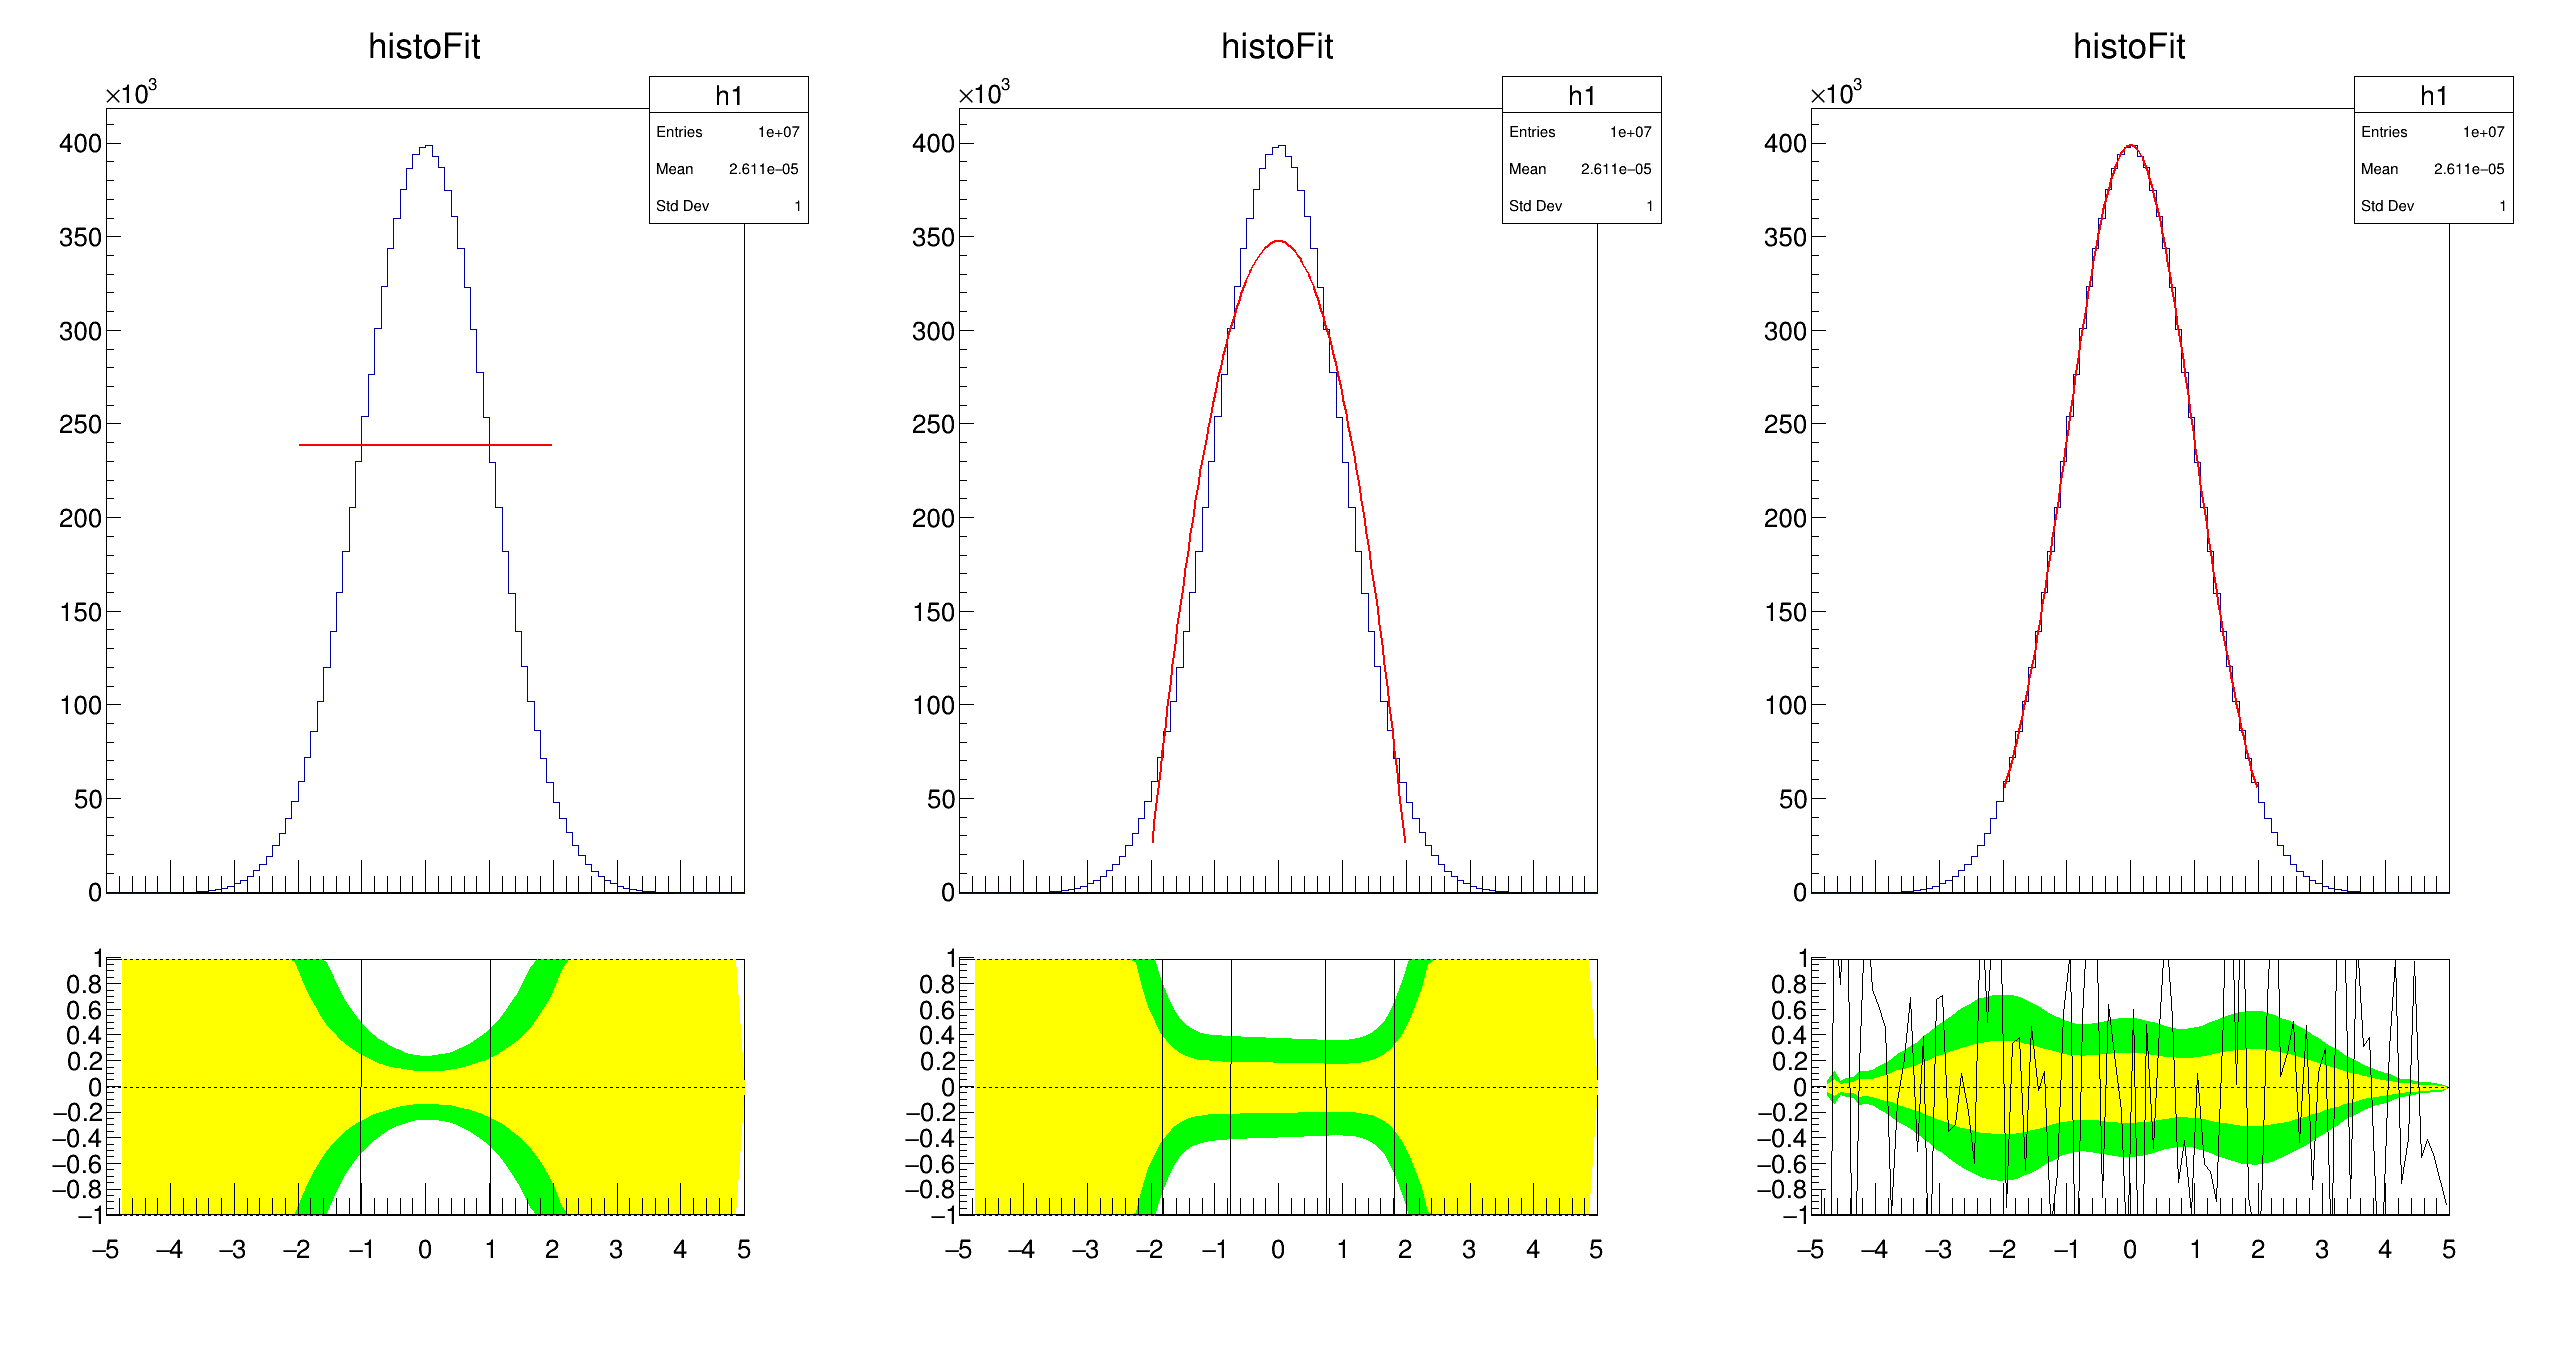
I simply fill a histogram with a Gaussian (randomly) then clone it twice so I fit the same histogram with 3 different functions on a limited [-2,2] range. I use: pol1, pol2, gaus fitting functions.

The continuous line at the bottom (TGraphAsymmErrors class if I understand correctly) is perfect: it shows the difference between the histogram and the fit function at each point and divides it by the uncertainty. So far I’ve seen the residual defined by the difference between the values without dividing, but it makes sense. The line doesn’t fluctuate around 0 in case of the first two bad fits BUT to my surprise the confidence intervals on the lower panel are pretty narrow for the fitted range.

My questions:

  1. Why do I have confidence bands & difference lines outside of my [-2,2] fitting range? How can I limit them to my fitting range?

  2. According to my knowledge better fits should have narrower bands, but around 0 pol1 and pol2 has narrower bands than the gaus even though they’re obviously bad fits. What’s the reason behind that?

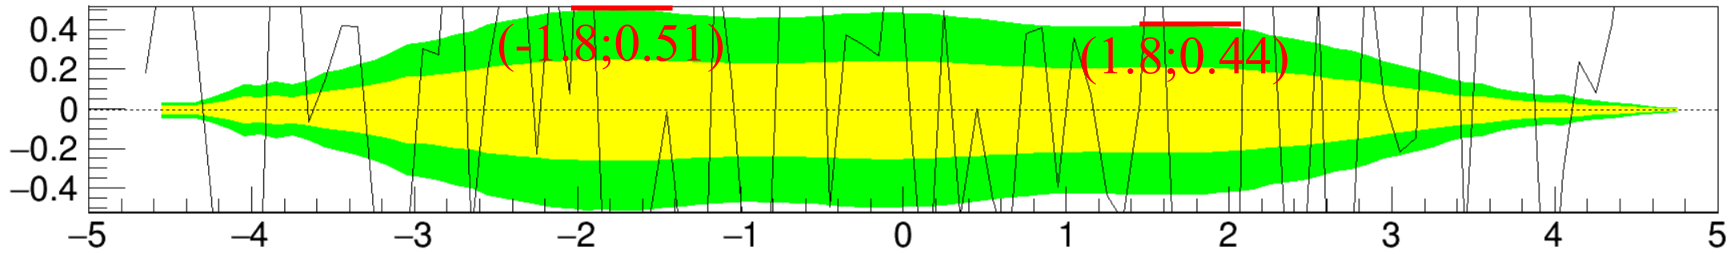
  3. Why do I have asymmetric confidence intervals? It seems like that on negative side the intervals are larger.

Thank you in advance!

I guess @moneta can help.

Hello @moneta !

Did you have a chance to look over my questions?

Cheers,
SRLeX

Hi,

Sorry for my late answer.
You are correct about the range. I think TRatioPlot is ignoring the given fitted range and extrapolate the function outside that range. We should open a issue on this.

What TRatioPlot shows are normalised residuals and confidence bands of the fitted function computed from the covariance matrix from the fit. Now if the fit is bad, the covariance matrix does not make statistically much sense, the observed deviations are much larger, eventually you might want to enlarge these bands by rescaling them using the chi2 obtained from the fit.

Concerning your last question, I don’t think the bands are asymmetric. They do not look asymmetric to me

Lorenzo

Thank you for the answer!

Can you open this issue please or should I follow some form? I think it would be greatly beneficial to be able to properly constrain the range for TRatioPlot.

Thanks for the explanation about the confidence bands!

For the 1-sigma band I wouldn’t argue that there is an asymmetry, but for 2-sigma band I’ve noticed after fitting a lot of Gaussians that the left side has always wider band then the right. And what caught my eyes is this is ALWAYS the case, with FillRandom(“gaus”) generation method I’ve never had a fit where the right side of the TRatioPlot had bigger values. The maximums are around x1 = -1.74 and x2 = 1.74 and the values are around y1 = 0.516, y2 = 0.438 (use 1e6 events for smooth bands). This is around a 15% difference.

I attach a picture to highlight the relevant parts. You can generate and closely inspect an example using the following code:

void ratioplot_example()
{
   // Generate histogram with Gaussian distribution
   auto h1 = new TH1D("h1", "histoFit", 100, -5, 5);
   h1->FillRandom("gaus", 1e6);

   // Gauss fit function
   auto gauss = new TF1("total", "gaus(0)", -5, 5);

   // Fitting
   h1->Fit(gauss, "OLR");
   auto rp1 = new TRatioPlot(h1);
   rp1->Draw();

   // Zoom on the relevant part
   rp1->GetLowerRefYaxis()->SetRangeUser(-0.52, 0.52);
}

I would not suspect asymmetry if with random generation sometimes I would get fits where the right side is wider, but that did not happen for me once. The difference ~15% also feels a bit much. But there might a be simple reason for this I just didn’t notice. Do you have any suggestions?

Cheers,
Lex

Okay, I only found one weak point in my reasoning, what if my histograms are not random? So I’ve checked the content of bin 50…

cout << h1->GetBinContent(50) << endl;

always returns 40055 which means that my histograms are not random so the asymmetry is probably just a single statistical fluctuation.

But why do I get the same histogram when I want to generate a random one each time:

// Generate histogram with Gaussian distribution
   auto h1 = new TH1D("h1", "histoFit", 100, -5, 5);
   h1->FillRandom("gaus", 1e6);

I thought FillRandom() gives me random histograms which follow the given distribution and not the same histogram over and over again! Any ideas?

Hello,

I thought you were speaking a up/down asymmetry not left/right. Yes, left/right differences are random differences. For generating always different random sequences, you need to do:

gRandom->SetSeed(0)

since TH1::FillRandom uses the default gRandom generator. See for this the documentation of TRandom3::SetSeed

Best,

Lorenzo

Thank you!

Now I get different histograms just fine. I really don’t want to push it too far and I would like to believe that this left/right differences are random, but I just ran a few fits and I could still see it… So I did a loop to save 100 different fitted histograms (you can check Mean, Std Dev values are different each time) and zoomed on the x = [-2.5,2.5] lower plot y = [0.4,0.6] range to emphasize the ROI.

I have checked the first 50 histograms myself and I still got ~15% difference on left/right at around x1 = -1.8 and x2 = 1.8. Out of the 50 histograms I always had wider 2-sigma confidence interval on the left.

My code:

void ratioplot_loop()
{
   TFile *f = new TFile("asymmetry.root", "UPDATE");
   auto c1 = new TCanvas("c1", "c1", 900, 900);
   auto h1 = new TH1D("h1", "histoFit", 100, -5, 5);
   auto gauss = new TF1("total", "gaus(0)", -5, 5);
   gRandom->SetSeed(0);

   for (int i = 0; i < 100; i++)
   {

      // Generate histogram with Gaussian distribution
      h1->FillRandom("gaus", 1e6);

      // Fitting
      h1->Fit(gauss, "QOLR");
      h1->GetXaxis()->SetRangeUser(-2.5, 2.5);
      auto rp1 = new TRatioPlot(h1);

      c1->cd();
      rp1->Draw();

      // Zoom on the relevant part
      rp1->GetLowerRefYaxis()->SetRangeUser(0.4, 0.6);

      // Save c1 to f file
      f->WriteObject(c1, Form("c1_%d", i));
      h1->Reset();
   }
}

And I also attach the root file I got from this. Correction: I attach a new one with only 60 fits so I stay under the 3 Mb upload limit. I checked the first 20 of these which also have wider bands on left side.

I would really like to believe that this left/right thing is random, but now that I have seen more than 80 of these for different histograms without any counterexample… I didn’t do the math, but what are the chances for that?

Any suggestions where do I go wrong? Can anyone else reproduce this weird asymmetry with my code? As you can see in the attached file, it is pretty consistent for me.

asymmetry_small.root (2.8 MB)

Hi,

Thank you for your investigation. I could reproduce the asymmetry looking at the left-right differences in the obtained confidence bands. It is statistically significant and probably due to a bug in TRatioPlot in computing the confidence intervals. I am investigating this now

Lorenzo

1 Like

I have now a PR fixing this issue: Fix the computation of the Confidence band of TRatioPlot by lmoneta · Pull Request #14840 · root-project/root · GitHub
Thank you very much for reporting this problem, your investigation was crucial to find this bug.

I can open also another issue for fixing the range

Lorenzo

1 Like

Thank you for all the help!

I’m glad that you have quickly found the source of the problem. Also, it’s nice to see that you found another bug (retrieving of fitting function), I encountered it too but wanted to test it further before bringing it up because it didn’t happen all the time.

I would appreciate if you could also open an issue for the range problem.

Best regards,
Lex