Hi ROOTers,
We wrote this code in order to analize multiphoton spectrum:
FILE* file;
TH1F* hsipm;
float x;
int bins = 0;
TF1* full;
int sigma = 5;

const Int_t npeaks = 40;
Double_t par[3*npeaks];
Double_t fpeaks(Double_t *x, Double_t *par) {
Double_t result = 0.;

   for (Int_t p=0;p<npeaks;p++) {

      Double_t norm  = par[3*p+0];
      Double_t mean  = par[3*p+1];
      Double_t sigma = par[3*p+2];

      result += norm*TMath::Gaus(x[0],mean,sigma);
   }
   return result;
}

Double_t gain = 0.;
Double_t pedestal = 0.;

/*

//par[0]=mu -  par[1]=p  - par[2]=N (articolo vinogradov sipm1 pag. 6)
  Double_t Vino(Double_t* x, Double_t* par){
  Double_t mu = par[0];
  Double_t p = par[1];
//Double_t N = par[2];
  Int_t N = int((x[0]-pedestal)/gain);
  Double_t B;

  Double_t f0 = exp(-mu);
  Double_t term = mu*(1-p);
  Double_t sum = 0.;

  if(N==0)
    return f0;

  for(int i=1; i<N; ++i){

    B = TMath::Gamma(N)/(TMath::Gamma(i+1)*TMath::Gamma(i)*TMath::Gamma(N-i+1));
    sum += B*pow(term,i)*pow(p,N-i);

  }

  return sum*f0;

}

*/

int Multiphoton_spectrum_analysis() {

  file = fopen("Run0_PHA_HG_0_10.txt", "r");

  TCanvas* c1 = new TCanvas("c1","HG Multiphoton Spectrum",10,10,1920,1980);

  gStyle->SetOptFit(000);

  c1->SetGridx();
  c1->SetGridy();

  TH1F* htmp = new TH1F("htemp","htemp",4096,0,4096);

  while(!feof(file)){

    fscanf(file,"%g\n",&x);

    htmp->SetBinContent(bins,x);

    ++bins;

  }

  hsipm = new TH1F("HG Multiphoton Spectrum","",bins,0,bins);

  for(int a=0; a<bins; ++a)

  hsipm->SetBinContent(a,htmp->GetBinContent(a));

  sigma = bins/1024+1;

  hsipm->GetYaxis()->SetTitle("#Entries");
  hsipm->GetXaxis()->SetTitle("ADC channels");;
  hsipm->GetXaxis()->SetRange(0,1300);


  TF1* f = new TF1("f",fpeaks,0,4096,3*npeaks);

  f->SetParameters(par);

  TSpectrum *s = new TSpectrum(npeaks);

  Int_t nfound;

  TString peak_name;
  TString full_func = "";

  TF1* g[npeaks];

  nfound = s->Search(hsipm,sigma,"",0.0007);

  printf("Found %d candidate peaks to fit\n", nfound);

  int peak_x_tmp[npeaks];
  double peak_x[npeaks];
  double peak_y[npeaks];

  TMath::Sort(nfound,s->GetPositionX(),peak_x_tmp,kFALSE);

  for(int a=0; a<nfound; ++a){

    peak_x[a] = s->GetPositionX()[peak_x_tmp[a]];
    peak_y[a] = s->GetPositionY()[peak_x_tmp[a]];

  }


  for(int a=0; a<nfound; ++a){

    peak_name.Form("g%d",a);
    g[a] = new TF1(peak_name,"gaus");

    TString func_tmp;

    func_tmp.Form("gaus(%d)+",3*a);
    full_func += func_tmp;

  }

  full_func.Remove(full_func.Length()-1);
  full = new TF1("full",full_func);

  for(int a=2; a<nfound; ++a){

    full->SetParLimits(3*a+0,peak_y[a]*0.5,peak_y[a]*1.1);
    full->SetParLimits(3*a+1,peak_x[a]-3*sigma, peak_x[a]+3*sigma);
    full->SetParLimits(3*a+2,0.5*sigma,6*sigma);

  }

  // pedestal

  full->SetParLimits(0,peak_y[0]*0.6,peak_y[0]*1.1);
  full->SetParLimits(1,peak_x[0]-1.2*sigma, peak_x[0]+1.2*sigma);
  full->SetParLimits(2,0.5*sigma,1*sigma);

  // 1 p.e.

  full->SetParLimits(3,peak_y[1]*0.5,peak_y[1]*1.1);
  full->SetParLimits(4,peak_x[1]-1.5*sigma, peak_x[1]+1.5*sigma);
  full->SetParLimits(5,0.5*sigma,4*sigma);
  full->SetNpx(4096*2);
  full->SetLineStyle(9);
  full->SetLineColor(2); //colore fit generale


  hsipm->Fit("full","","same",35.,peak_x[nfound-1]+4*sigma);
  hsipm->SetLineColor(1); //colore dei dati

  double fPar[npeaks] = {0.};
  double fErr[npeaks*3] = {0.};

  full->GetParameters(&fPar[0]);

  for(int a=0; a<nfound*3; ++a)

    fErr[a] = full->GetParErrors()[a];

  TF1* fg[npeaks];

  TString gname;

  double m_tmp = fPar[1];
  double s_tmp = fPar[2];

  fg[0] = new TF1("ped","gaus",m_tmp-3*s_tmp,m_tmp+3*s_tmp);
  fg[0]->SetParameters(&fPar[0]);
  fg[0]->SetLineColor(9); //colore piedistallo
  //fg[0]->Draw("same");

  for(int a=1; a<nfound; ++a){

    m_tmp = fPar[3*a+1];
    s_tmp = fPar[3*a+2];

    gname.Form("%d p.e.",a);

    fg[a] = new TF1(gname,"gaus",m_tmp-3*s_tmp,m_tmp+3*s_tmp);
    fg[a]->SetParameters(&fPar[3*a]);
    fg[a]->SetLineColor(9); //colore gaussiane
    //fg[a]->Draw("same");

  }

   double aNpeak[npeaks];
   double aConst[npeaks];
   double aMean[npeaks];
   double aSig[npeaks];
   double aConstErr[npeaks];
   double aMeanErr[npeaks];
   double aSigErr[npeaks];

   const double sqrt2pi = sqrt(2 * acos(-1.));

   for (int a = 1; a < nfound; ++a)

   {
     aNpeak[a - 1] = a;
     aMean[a - 1] = fPar[3 * a + 1];
     aMeanErr[a - 1] = fErr[3 * a + 1];
     aSig[a - 1] = fPar[3 * a + 2];
     aSigErr[a - 1] = fErr[3 * a + 2];
     aConst[a - 1] = fPar[3 * a] * sqrt2pi * aSig[a - 1];
     aConstErr[a - 1] = sqrt2pi * (fErr[3 * a] * aSig[a - 1] + aSigErr[a - 1] * fPar[3 * a]);
  }

  FILE* outfile;

  outfile = fopen("Gaussian_Parameters.txt", "w");

  for(int a=0; a<nfound; ++a)


  fprintf(outfile, "%d \t %f \t %f \t %f \t %f \t %f \t %f \n", a, fPar[3 * a], fErr[3*a], fPar[3 * a + 1], fErr[3*a+1], fPar[3 * a + 2], fErr[3*a+2]);
  fclose(outfile);

  TCanvas* c2 = new TCanvas("c2","HG Multiphoton Spectrum Analysis",10,10,1920,1980);

  c2->UseCurrentStyle();
  gStyle->SetOptFit(111);

  c2->Divide(2,2);
  c2->cd(1);
  c2->GetPad(1)->SetGridx();
  c2->GetPad(1)->SetGridy();
  c2->Update();

  Double_t xErr[npeaks] = {0.};

  TGraphErrors* mean = new TGraphErrors(nfound-1,aNpeak,aMean,xErr,aMeanErr);

  mean->SetMarkerStyle(22);
  mean->SetTitle("HG Calibration");
  mean->GetXaxis()->SetTitle("#p.e.");
  mean->GetYaxis()->SetTitle("ADC channels");
  mean->Draw("ap");

  TF1* fgain = new TF1("fgain","pol1");

  mean->Fit("fgain","","same",0.,nfound-2);
  mean->GetYaxis()->SetRangeUser(0.,aMean[nfound-2]+200.);

  c2->cd(1)->Update();

  pedestal = fgain->GetParameter(0);
  gain = fgain->GetParameter(1);

  c2->cd(2);
  c2->GetPad(2)->SetGridx();
  c2->GetPad(2)->SetGridy();

  Double_t aDpp[npeaks] = {0.};
  Double_t aDppErr[npeaks] = {0.};
  Double_t mean_dpp = 0.;

  for(int a=0; a<nfound-2; ++a){

    aDpp[a] = aMean[a+1]-aMean[a];
    aDppErr[a] = aMeanErr[a+1]+aMeanErr[a];
    mean_dpp += aDpp[a];
  }

  mean_dpp /= (nfound-2);

  TGraphErrors* gDpp = new TGraphErrors(nfound-2,aNpeak,aDpp,xErr,aDppErr);

  gDpp->SetMarkerStyle(22);
  gDpp->SetTitle("Delta peak to peak distribution");
  gDpp->GetXaxis()->SetTitle("#p.e.");
  gDpp->GetYaxis()->SetTitle("ADC channels");
  gDpp->Draw("ap");
  gDpp->Fit("pol1","","same",0.,nfound-3);
  gDpp->GetYaxis()->SetRangeUser(mean_dpp-50,mean_dpp+50.);


  c2->cd(3);
  c2->GetPad(3)->SetGridx();
  c2->GetPad(3)->SetGridy();

  TGraphErrors* gConst = new TGraphErrors(nfound-1,aNpeak,aConst,xErr,aConstErr);

  gConst->SetMarkerStyle(22);
  gConst->SetTitle("Gaussian Normalization par distribution");
  gConst->GetXaxis()->SetTitle("#p.e.");
  gConst->GetYaxis()->SetTitle("#Entries");
  gConst->Draw("ap");


  TF1 *poisson = new TF1("poisson","[0]*TMath::Power(([1]/[2]),(x/[2]))*(TMath::Exp(-([1]/[2])))/TMath::Gamma((x/[2])+1.)", 0, nfound);

  poisson->SetParameters(1.e6, 9., 2.);
  poisson->SetNpx(4096*2);

  gConst->Fit(poisson,"R","same",0.,nfound-2);


  c2->cd(4);
  c2->GetPad(4)->SetGridx();
  c2->GetPad(4)->SetGridy();

  TGraphErrors* gSig = new TGraphErrors(nfound-1,aNpeak,aSig,xErr,aSigErr);

  gSig->SetMarkerStyle(22);
  gSig->SetTitle("Gaussian Sigma par distribution");
  gSig->GetXaxis()->SetTitle("#p.e.");
  gSig->GetYaxis()->SetTitle("ADC channels");
  gSig->Draw("ap");
  gSig->GetYaxis()->SetRangeUser(0.,50.);

  TF1* pol1 = new TF1("pol1","pol1");

  pol1->SetParameters(20.,0.5);

  gSig->Fit("pol1","","same",0.,nfound-2);

  return 0;
}
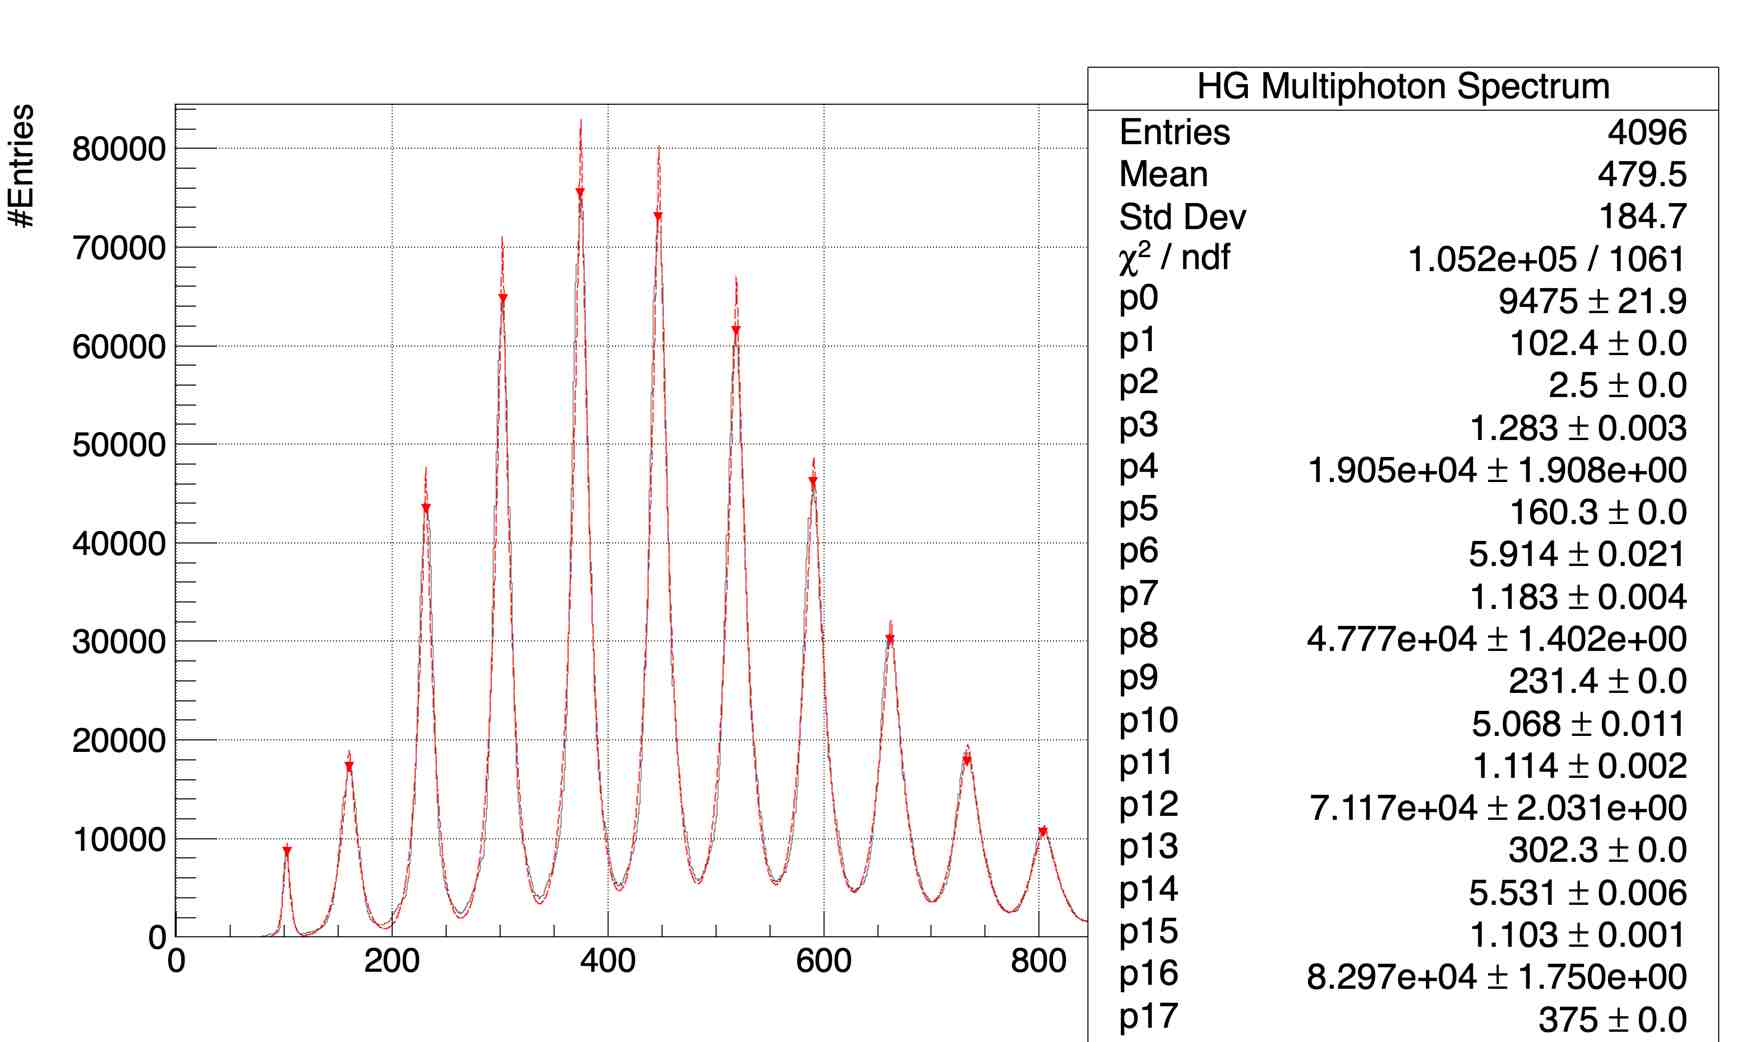
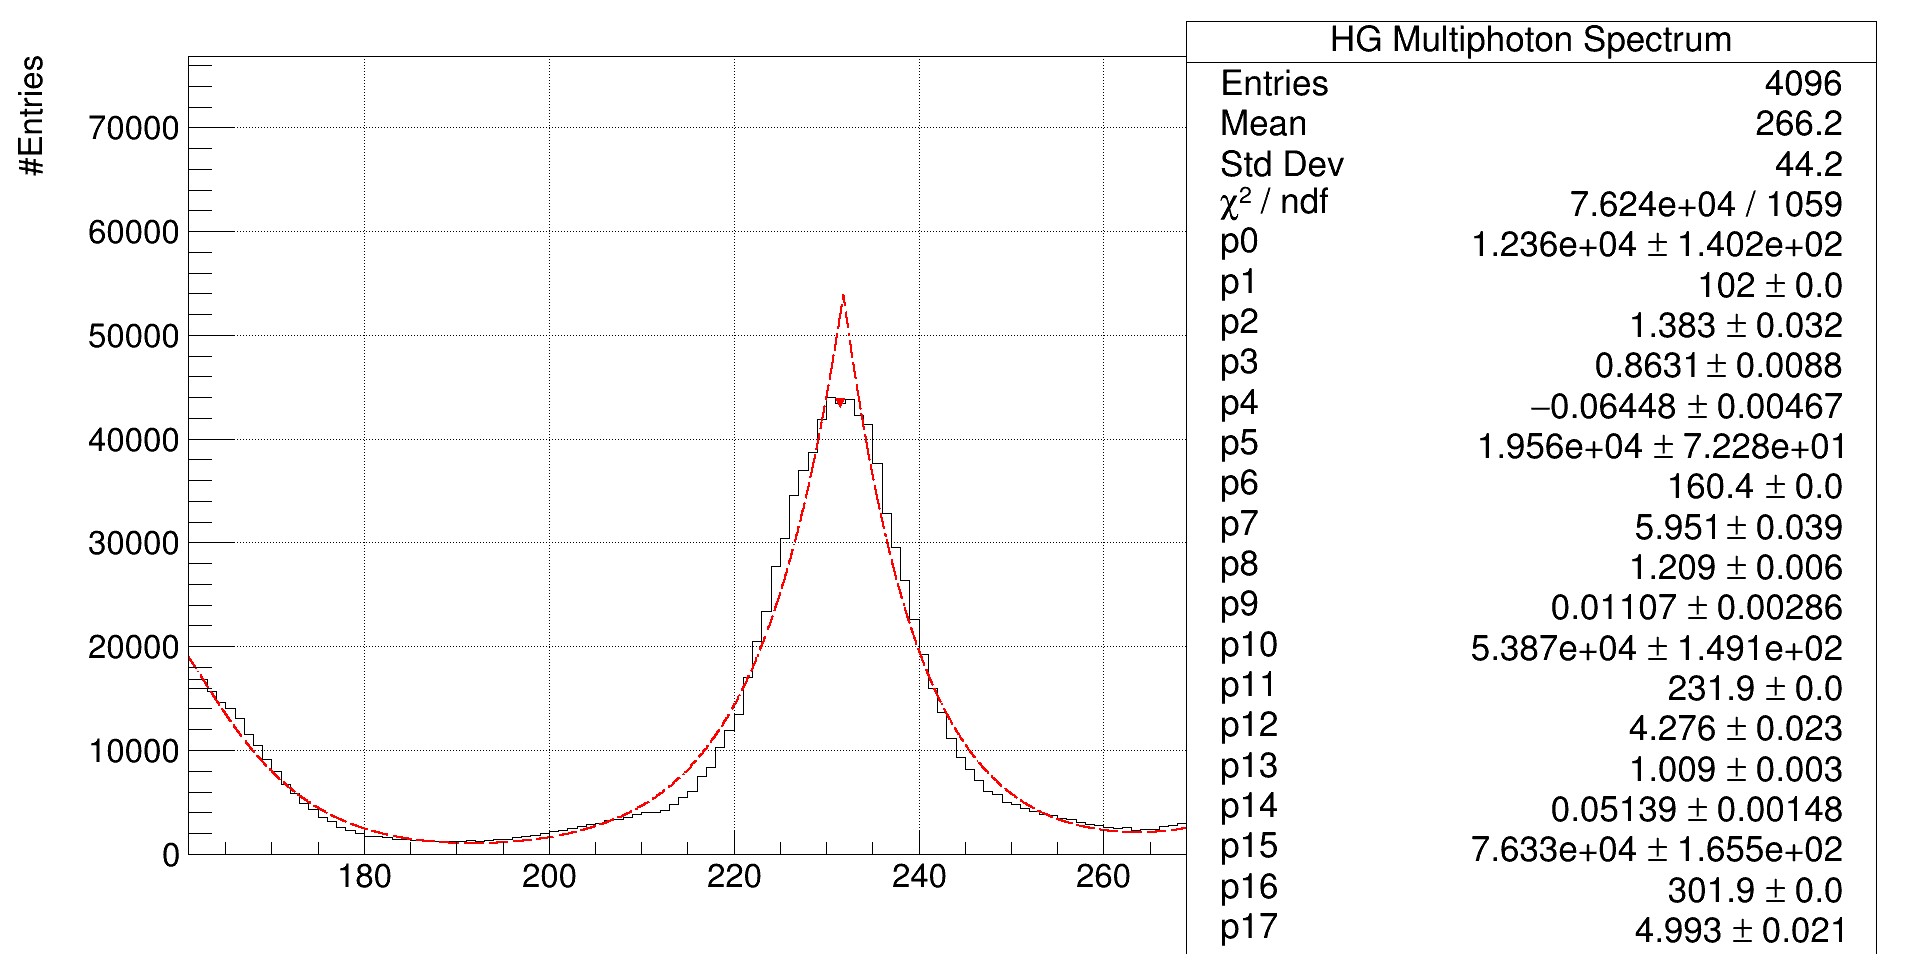
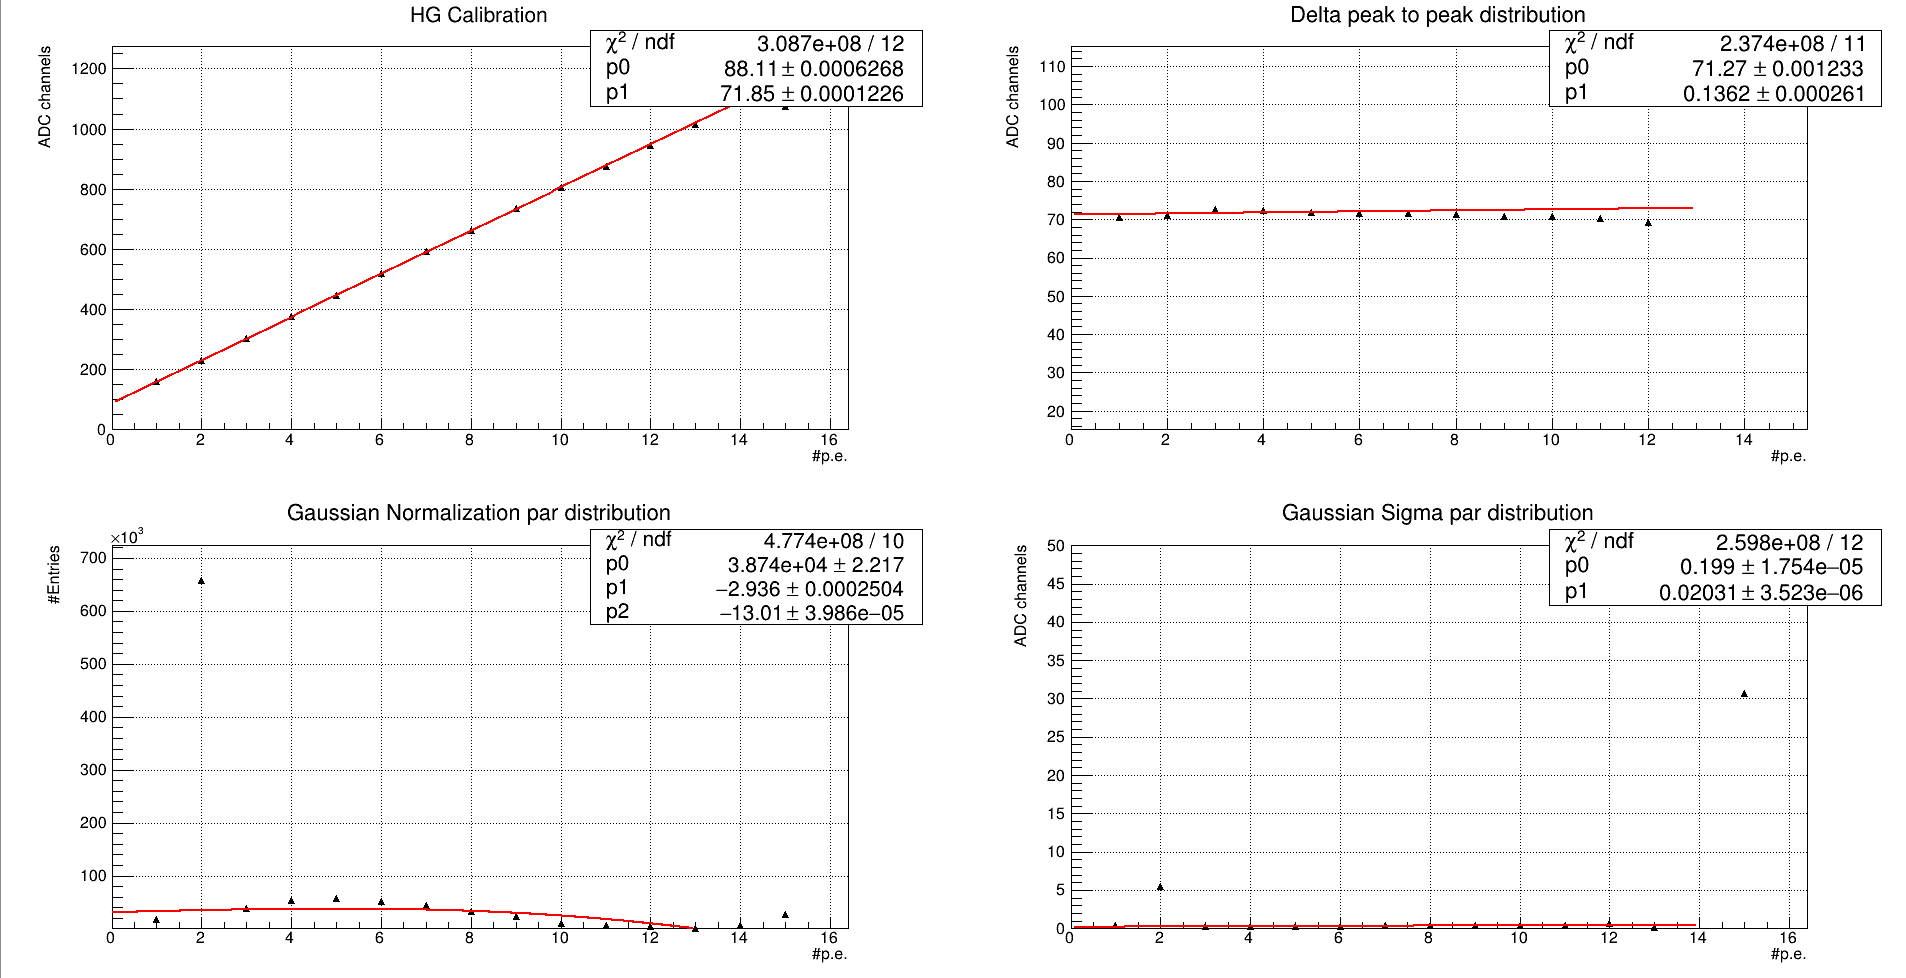
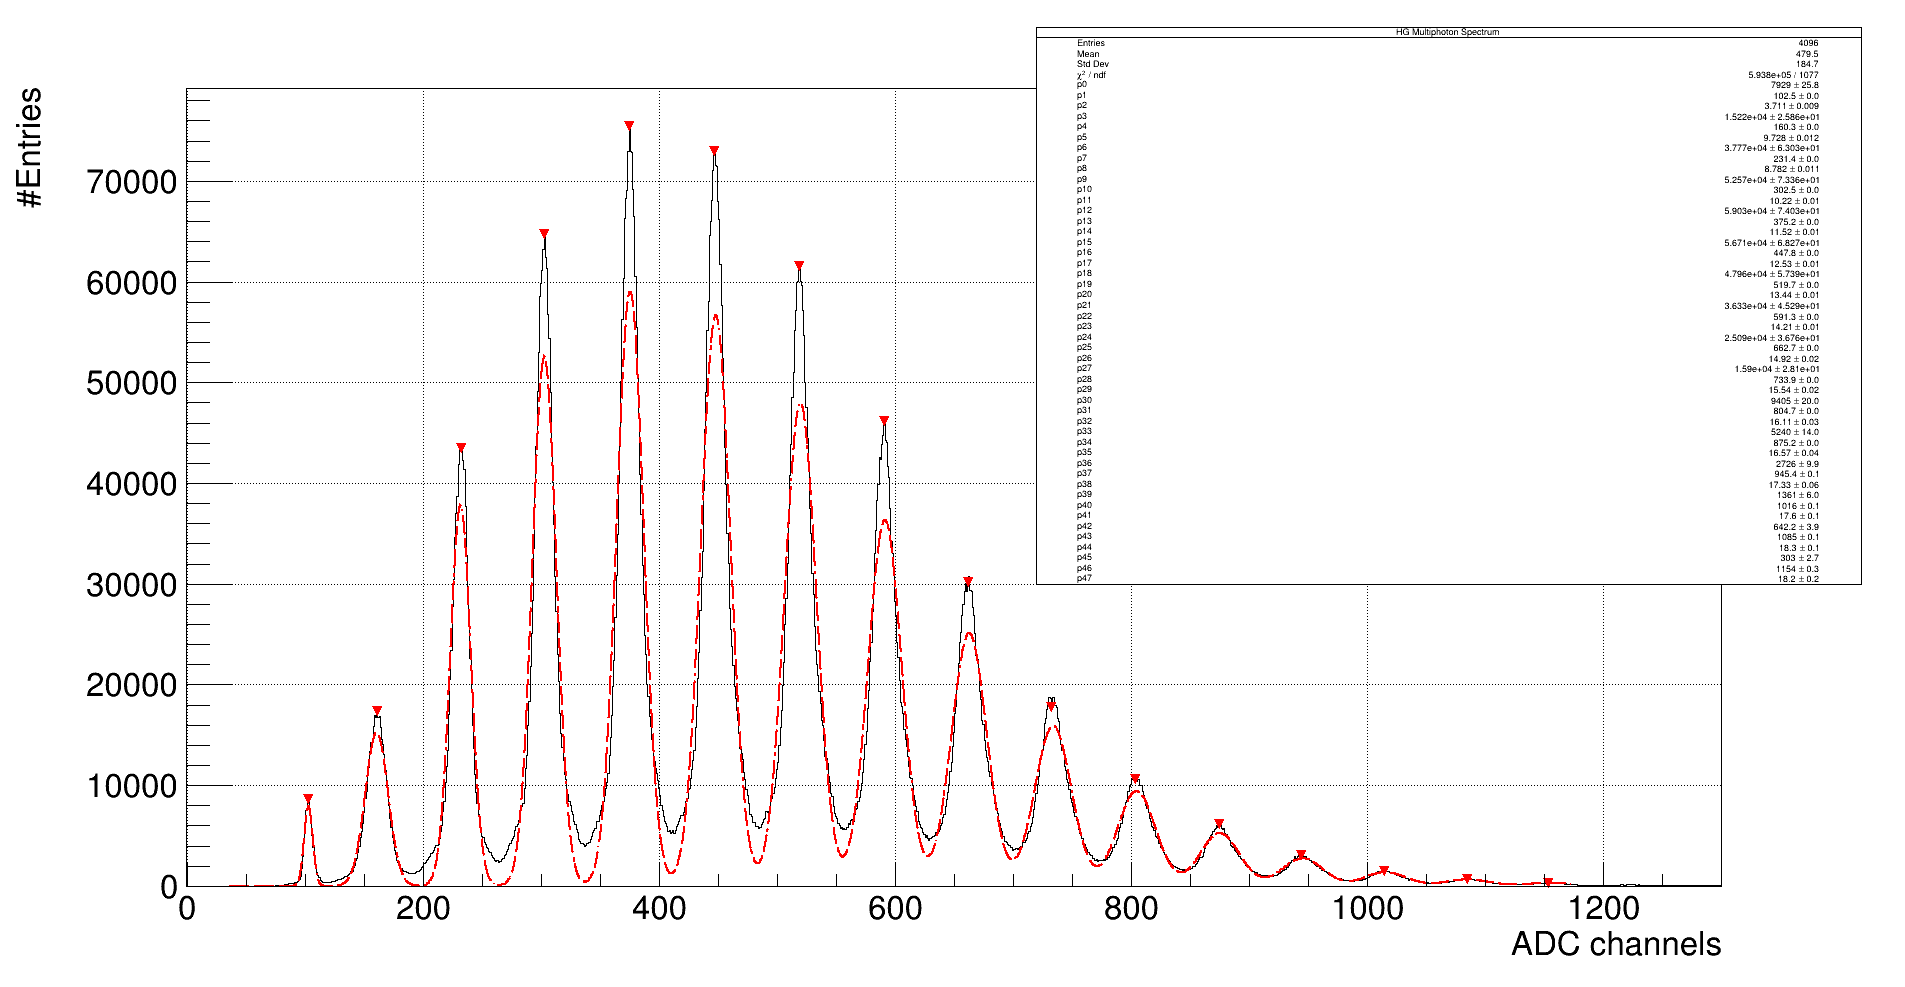
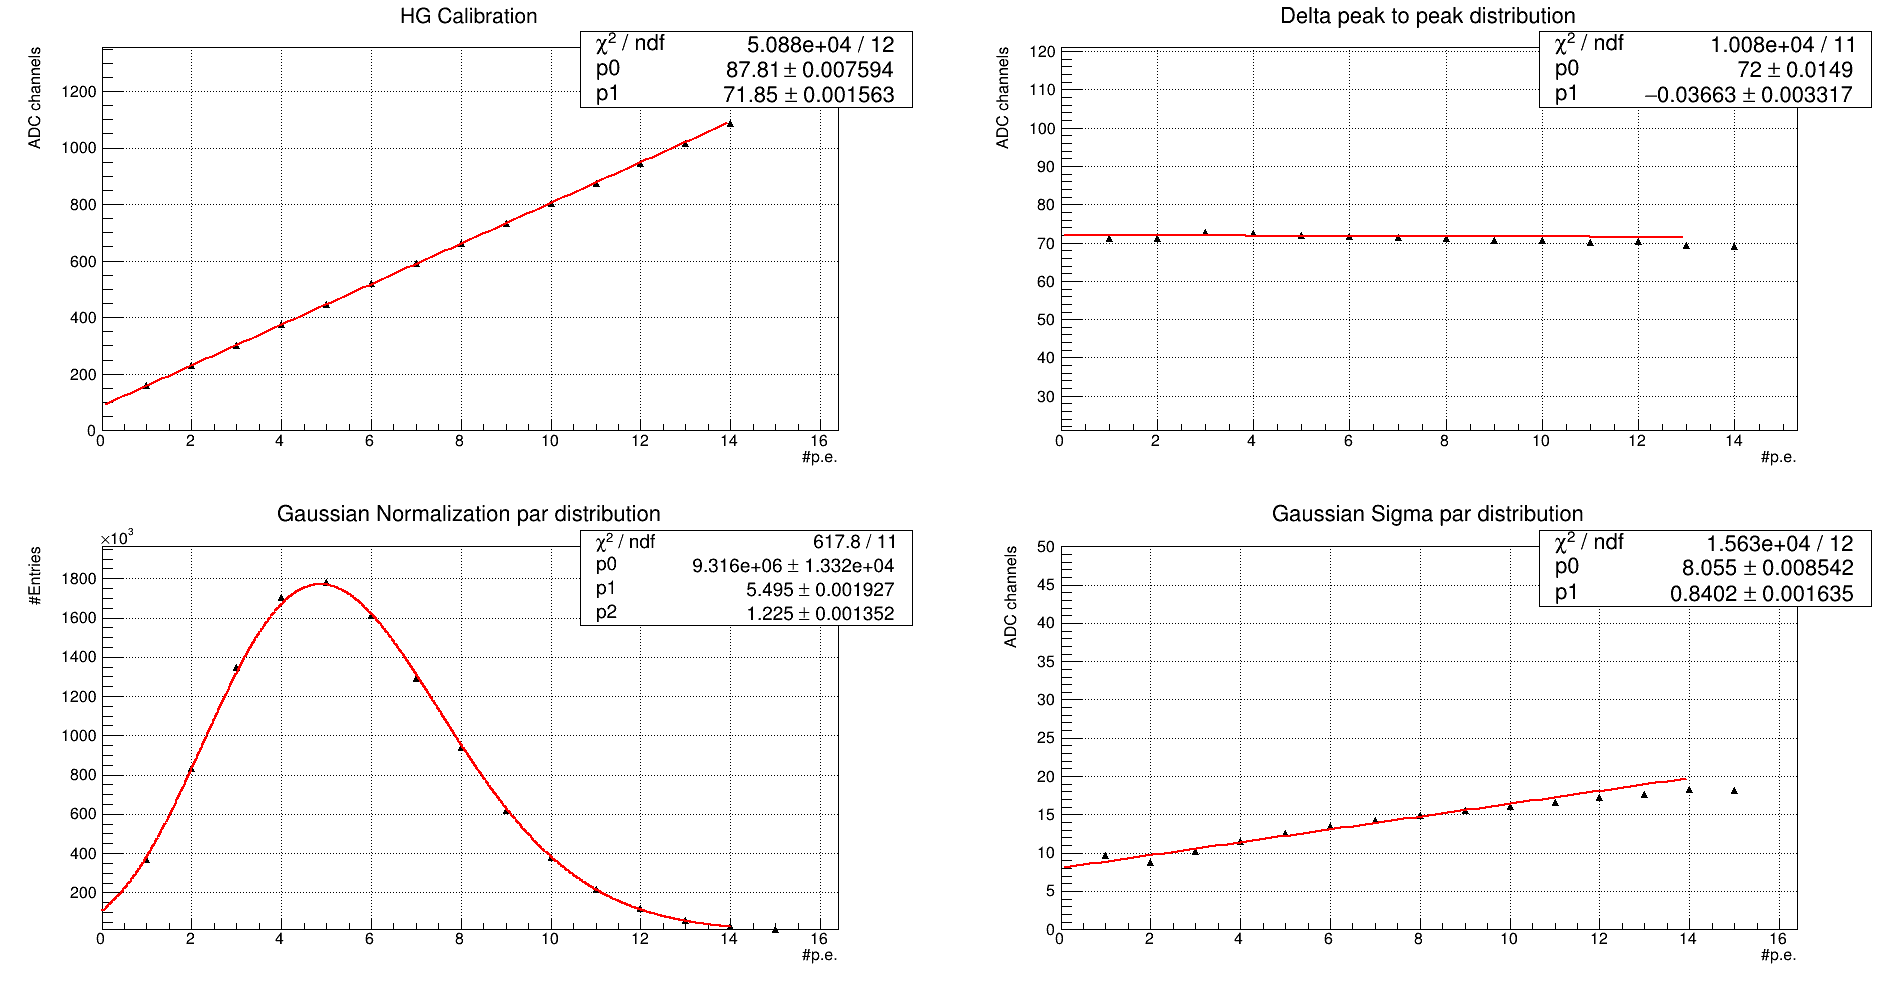
And we get this results:
and
meanwhile in the terminal i get this warning:
Info in <ROOT::Math::ParameterSettings>: lower/upper bounds outside current parameter value. The value will be set to (low+up)/2
-
How can I delete this warning? I suppose that i need to set parameterlimits but i did it.
-
Why the chi squared are so big? The points lie on the lines…
-
I saw that TSpectrum is deprecated, is there an alternative?
-
There is a way to set two different style about statistic table? I used
gStyle->SetOptFit(000)andgStyle->SetOptFit(111)in the two canvas but doesnt work. -
There is a way to do a similar fit (green) in ROOT? How?

I mean, do a multi gaussian fit like green line.