Here one more improvement / flexibility. In the code snippet one can put in front of a peak, a “ghost” peak . For these peaks there are 3 global fit parameters:
- relative strength of this peak wrt the parent
- exponential decay factor of the strength as a function of the ADC channel
- shift to the left wrt the parent
In the code the last 2 are fixed
#include "TCanvas.h"
#include "TStyle.h"
#include "TGraphErrors.h"
#include "TArrayD.h"
#include "TH1F.h"
#include "TSpectrum.h"
#include "TF1.h"
const Int_t npeaks = 40;
const Int_t nrParPeak = 5;
Double_t HyperGaus(Double_t *x,Double_t *par)
{
const Double_t norm = par[0];
const Double_t mean1 = par[1];
const Double_t sigma = par[2];
const Double_t gamma = par[3];
const Double_t asym = par[4];
// Satellite peak parameters
const Double_t relnorm = par[5];
const Double_t decay = par[6];
const Double_t shift = par[7];
if (sigma == 0) return 1.e30;
const Double_t arg1 = (x[0]-mean1 > 0) ? TMath::Abs((x[0]-mean1)/sigma/(1-asym))
: TMath::Abs((x[0]-mean1)/sigma/(1+asym));
const Double_t powarg1 = TMath::Power(arg1,gamma);
const Double_t peak1 = TMath::Exp(-0.5*powarg1);
const Double_t mean2 = mean1-shift;
const Double_t arg2 = (x[0]-mean2 > 0) ? TMath::Abs((x[0]-mean2)/sigma/(1-asym))
: TMath::Abs((x[0]-mean2)/sigma/(1+asym));
const Double_t powarg2 = TMath::Power(arg2,gamma);
const Double_t peak2 = TMath::Exp(-0.5*powarg2);
const Double_t res = norm*(peak1+relnorm*TMath::Exp(decay*mean1)*peak2);
return res;
}
Int_t nfound;
Double_t SumHyperGaus(Double_t *x,Double_t *par) {
TArrayD parPeak(nrParPeak+3);
Double_t result = 0.;
for (Int_t p=0;p<nfound;p++) {
Int_t off = nrParPeak*p;
for (Int_t i = 0; i < nrParPeak; ++i)
parPeak[i] = par[off+i];
parPeak[nrParPeak] = par[nrParPeak*nfound];
parPeak[nrParPeak+1] = par[nrParPeak*nfound+1];
parPeak[nrParPeak+2] = par[nrParPeak*nfound+2];
result += HyperGaus(x,parPeak.GetArray());
}
return result;
}
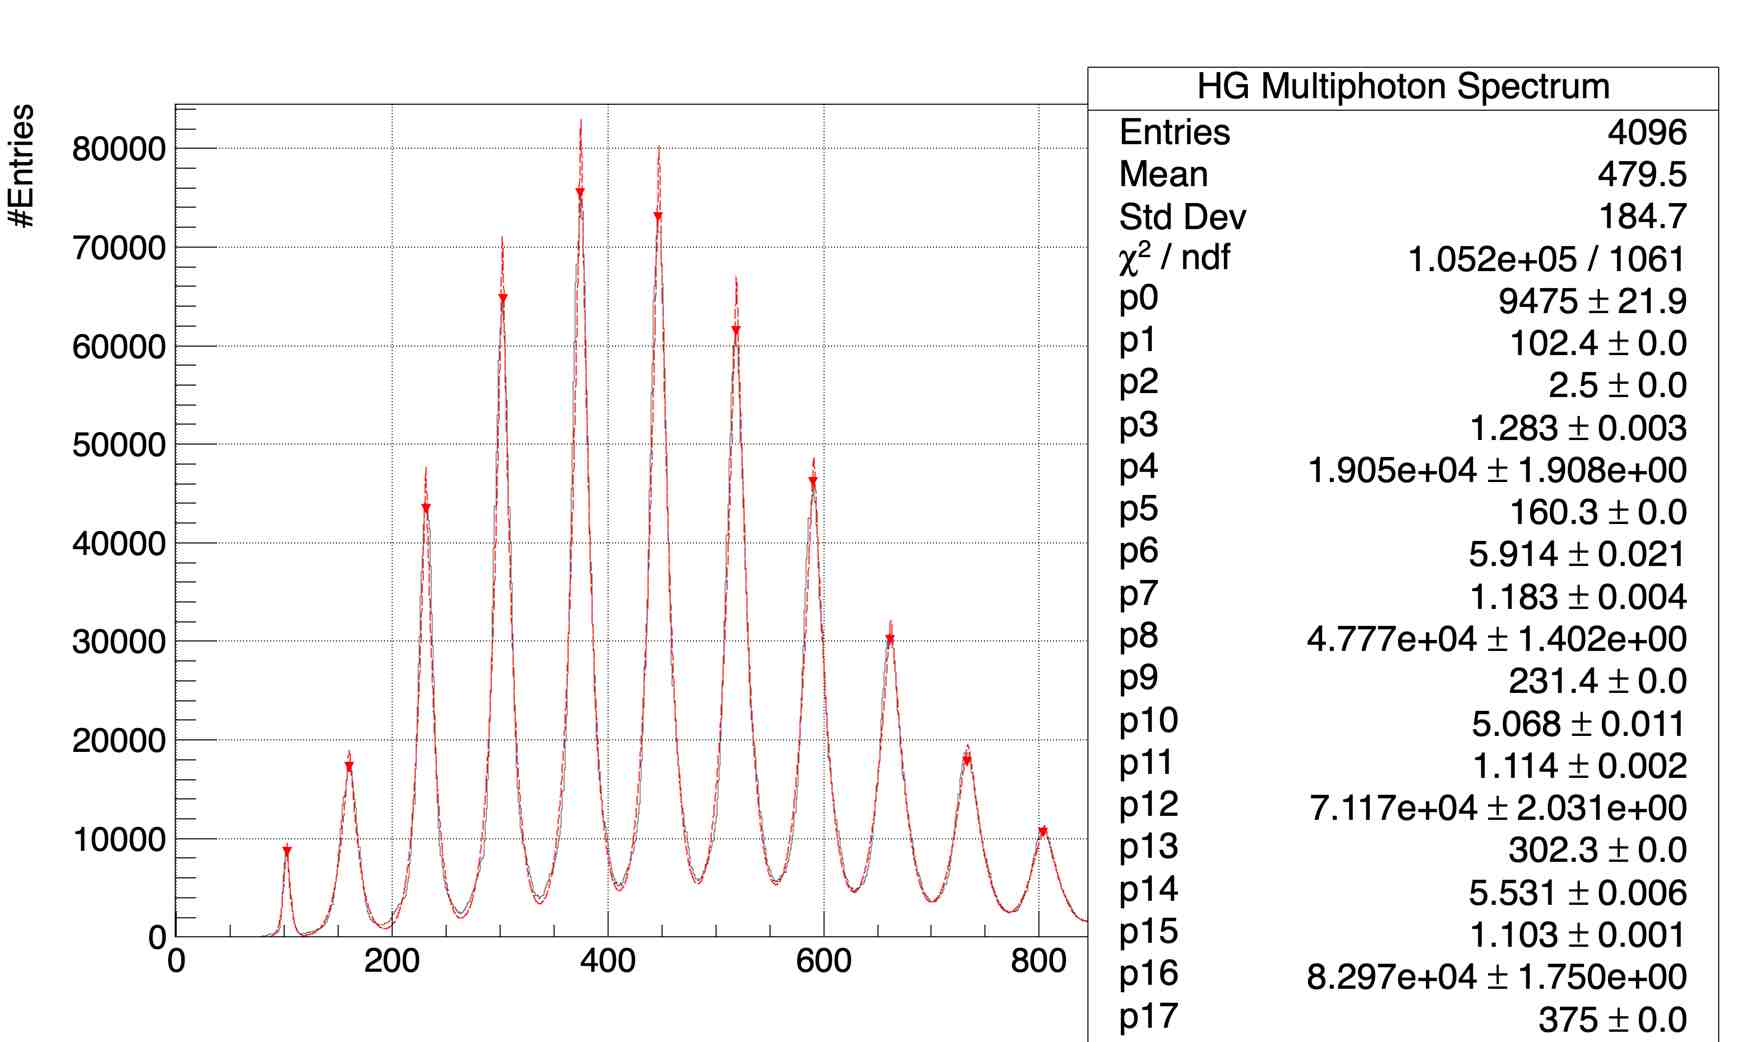
int Multiphoton_spectrum_analysis() {
FILE *file = fopen("./Run0_PHA_HG_0_10.txt", "r");
TCanvas* c1 = new TCanvas("c1","HG Multiphoton Spectrum",10,10,1920,1980);
gStyle->SetOptFit(000);
c1->SetGridx();
c1->SetGridy();
TH1F* htmp = new TH1F("htemp","htemp",4096,0,4096);
Int_t bins = 0;
Float_t x;
while(!feof(file)){
fscanf(file,"%g\n",&x);
htmp->SetBinContent(bins,x);
++bins;
}
TH1F *hsipm = new TH1F("HG Multiphoton Spectrum","",bins,0,bins);
for(int a=0; a<bins; ++a)
hsipm->SetBinContent(a,htmp->GetBinContent(a));
Int_t sigma = bins/1024+1;
hsipm->GetYaxis()->SetTitle("#Entries");
hsipm->GetXaxis()->SetTitle("ADC channels");;
hsipm->GetXaxis()->SetRange(0,1300);
TSpectrum *s = new TSpectrum(npeaks);
nfound = s->Search(hsipm,sigma,"",0.0007);
printf("Found %d candidate peaks to fit\n", nfound);
int peak_x_tmp[nfound];
double peak_x[nfound];
double peak_y[nfound];
TMath::Sort(nfound,s->GetPositionX(),peak_x_tmp,kFALSE);
for(int a=0; a<nfound; ++a){
peak_x[a] = s->GetPositionX()[peak_x_tmp[a]];
peak_y[a] = s->GetPositionY()[peak_x_tmp[a]];
}
TF1* f = new TF1("f",SumHyperGaus,0,4096,nrParPeak*nfound+3);
f->SetNpx(4096*2);
f->SetLineStyle(9);
f->SetLineColor(2); //colore fit generale
for(int a=0; a<nfound; ++a){
const Int_t off = nrParPeak*a;
f->SetParameter(off+0,peak_y[a]);
f->SetParameter(off+1,peak_x[a]);
f->SetParameter(off+2,sigma);
f->SetParameter(off+3,1.2);
f->SetParameter(off+4,0.0);
}
f->SetParameter(nrParPeak*nfound+0,0.01);
f->SetParameter(nrParPeak*nfound+1,-0.001);
f->SetParameter(nrParPeak*nfound+2,30.0);
for(int a=2; a<nfound; ++a){
const Int_t off = nrParPeak*a;
//f->SetParLimits(off+0,peak_y[a]*0.5,peak_y[a]*1.1);
//f->SetParLimits(off+1,peak_x[a]-3*sigma, peak_x[a]+3*sigma);
//f->SetParLimits(off+2,0.5*sigma,6*sigma);
f->SetParLimits(off+3,1.2,1.2);
}
f->SetParLimits(nrParPeak*nfound+0,0.,0.05);
f->SetParLimits(nrParPeak*nfound+1,-0.001,-0.001);
f->SetParLimits(nrParPeak*nfound+2,30.,30.);
// pedestal
//f->SetParLimits(0,peak_y[0]*0.6,peak_y[0]*1.1);
//f->SetParLimits(1,peak_x[0]-1.2*sigma, peak_x[0]+1.2*sigma);
//f->SetParLimits(2,0.5*sigma,1*sigma);
f->SetParLimits(3,1.2,1.2);
// 1 p.e.
//f->SetParLimits(5,peak_y[1]*0.5,peak_y[1]*1.1);
//f->SetParLimits(6,peak_x[1]-1.5*sigma, peak_x[1]+1.5*sigma);
//f->SetParLimits(7,0.5*sigma,4*sigma);
f->SetParLimits(8,1.2,1.2);
// option I makes sure the area under fitted curve is fitted, but this
// takes a significant amount of CPU time
//hsipm->Fit("f","I","same",35.,peak_x[nfound-1]+4*sigma);
hsipm->Fit("f","","same",35.,peak_x[nfound-1]+4*sigma);
hsipm->SetLineColor(1); //colore dei dati
TArrayD fPar(nrParPeak*nfound);
TArrayD fErr(nrParPeak*nfound);
for(int a=0; a<nfound; ++a) {
const Int_t off = nrParPeak*a;
fPar[off+0] = f->GetParameter(off+0);
fPar[off+1] = f->GetParameter(off+1);
fPar[off+2] = f->GetParameter(off+2);
fPar[off+3] = f->GetParameter(off+3);
fPar[off+4] = f->GetParameter(off+4);
fErr[off+0] = f->GetParError(off+0);
fErr[off+1] = f->GetParError(off+1);
fErr[off+2] = f->GetParError(off+2);
fErr[off+3] = f->GetParError(off+3);
fErr[off+4] = f->GetParError(off+4);
}
TF1* fg[npeaks];
double m_tmp = fPar[1];
double s_tmp = fPar[2];
fg[0] = new TF1("ped",HyperGaus,m_tmp-3*s_tmp,m_tmp+3*s_tmp);
fg[0]->SetParameters(&fPar[0]);
fg[0]->SetLineColor(9); //colore piedistallo
//fg[0]->Draw("same");
for(int a=1; a<nfound; ++a){
const Int_t off = nrParPeak*a;
m_tmp = fPar[off+1];
s_tmp = fPar[off+2];
TString gname;
gname.Form("%d p.e.",a);
fg[a] = new TF1(gname,HyperGaus,m_tmp-3*s_tmp,m_tmp+3*s_tmp);
fg[a]->SetParameters(&fPar[off]);
fg[a]->SetLineColor(9); //colore gaussiane
//fg[a]->Draw("same");
}
TArrayD aNpeak(nfound-1);
TArrayD aConst(nfound-1);
TArrayD aMean (nfound-1);
TArrayD aSig (nfound-1);
TArrayD aGamma(nfound-1);
TArrayD aASymm(nfound-1);
TArrayD aConstErr(nfound-1);
TArrayD aMeanErr (nfound-1);
TArrayD aSigErr (nfound-1);
TArrayD aGammaErr(nfound-1);
TArrayD aASymmErr(nfound-1);
const double sqrt2pi = sqrt(2 * acos(-1.));
for (int a = 1; a < nfound; ++a)
{
const Int_t off = nrParPeak*a;
aNpeak [a-1] = a;
aMean [a-1] = fPar[off+1];
aMeanErr [a-1] = fErr[off+1];
aSig [a-1] = fPar[off+2];
aSigErr [a-1] = fErr[off+2];
aGamma [a-1] = fPar[off+3];
aGammaErr[a-1] = fErr[off+3];
aASymm [a-1] = fPar[off+4];
aASymmErr[a-1] = fErr[off+4];
aConst [a-1] = fPar[off]*sqrt2pi*aSig[a-1];
aConstErr[a-1] = sqrt2pi*(fErr[off]*aSig[a-1]+aSigErr[a-1]*fPar[off]);
}
FILE* outfile;
outfile = fopen("Gaussian_Parameters.txt", "w");
for(int a=0; a<nfound; ++a) {
const Int_t off = nrParPeak*a;
fprintf(outfile, "%d \t %f \t %f \t %f \t %f \t %f \t %f \t %f \t %f \t %f \t %f \n",
a,fPar[off],fErr[off],fPar[off+1],fErr[off+1],fPar[off+2],fErr[off+2],
fPar[off+3],fErr[off+3],fPar[off+4],fErr[off+4]);
}
fclose(outfile);
TCanvas* c2 = new TCanvas("c2","HG Multiphoton Spectrum Analysis",10,10,1920,1980);
c2->UseCurrentStyle();
gStyle->SetOptFit(111);
c2->Divide(2,3);
c2->cd(1);
c2->GetPad(1)->SetGridx();
c2->GetPad(1)->SetGridy();
c2->Update();
TArrayD xErr(npeaks);
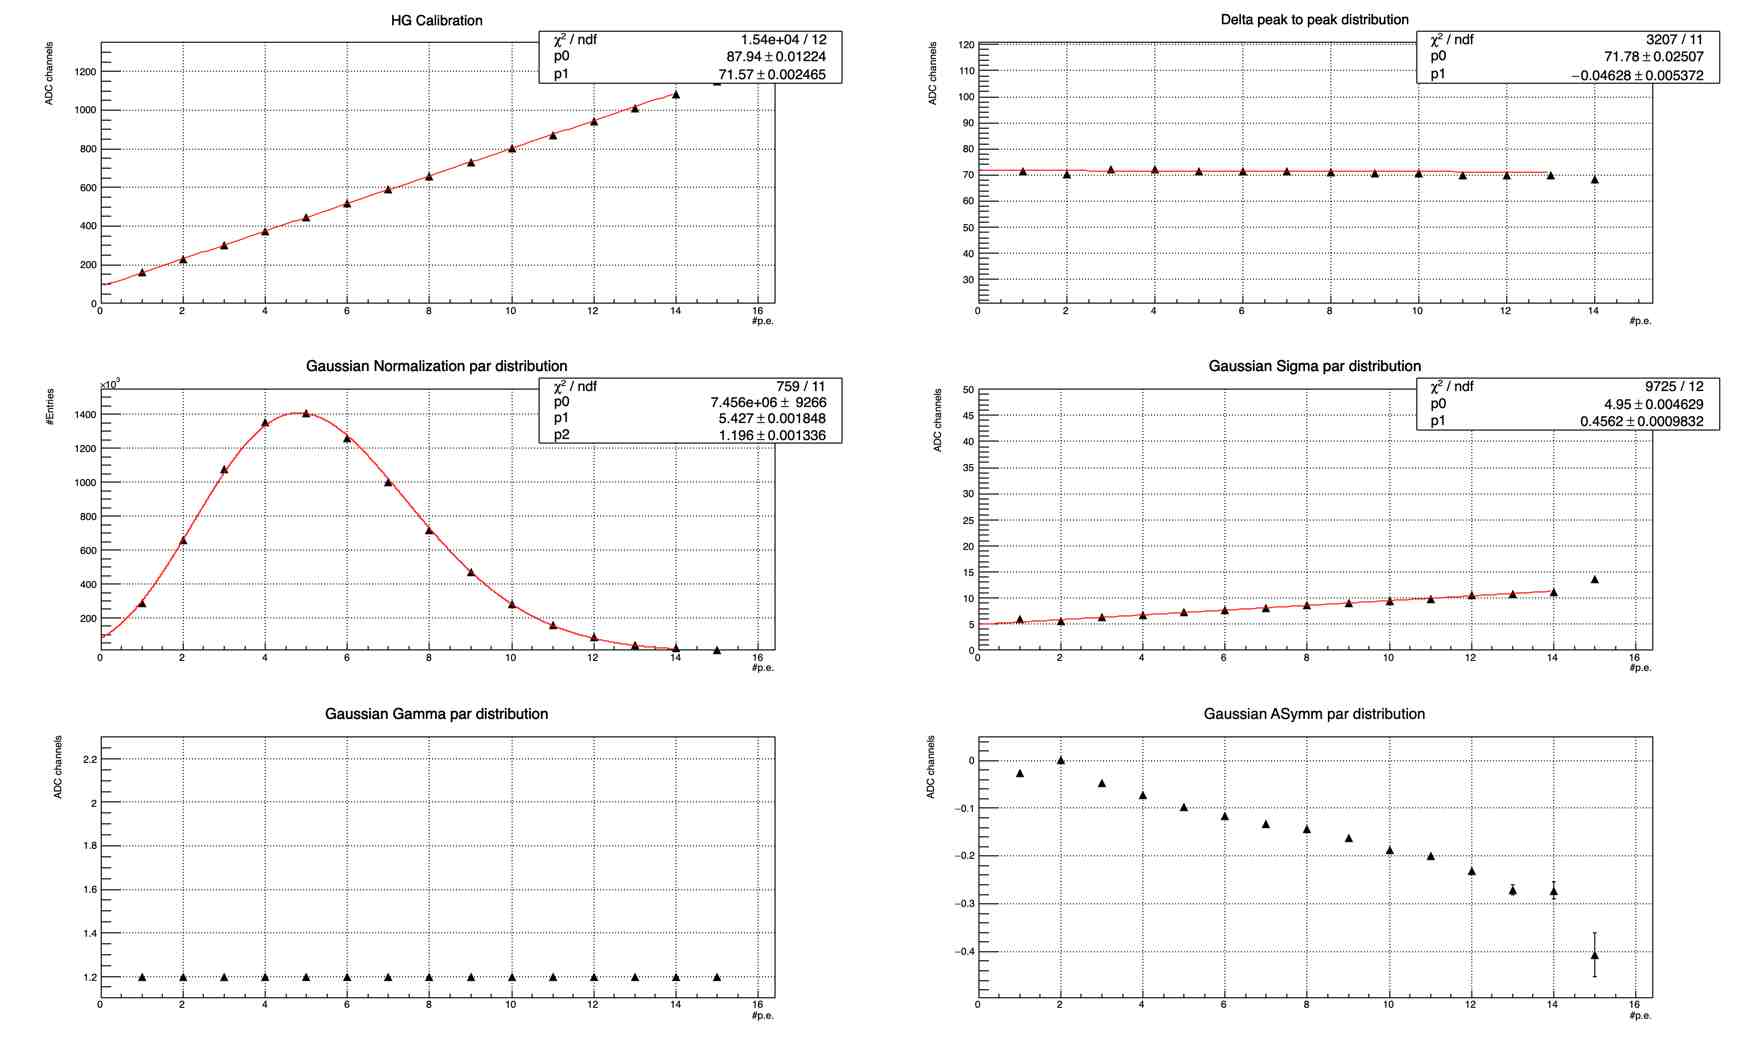
TGraphErrors* mean = new TGraphErrors(nfound-1,aNpeak.GetArray(),aMean.GetArray(),xErr.GetArray(),aMeanErr.GetArray());
mean->SetMarkerStyle(22);
mean->SetTitle("HG Calibration");
mean->GetXaxis()->SetTitle("#p.e.");
mean->GetYaxis()->SetTitle("ADC channels");
mean->Draw("ap");
TF1* fgain = new TF1("fgain","pol1");
mean->Fit("fgain","","same",0.,nfound-2);
mean->GetYaxis()->SetRangeUser(0.,aMean[nfound-2]+200.);
c2->cd(1)->Update();
Double_t pedestal = fgain->GetParameter(0);
Double_t gain = fgain->GetParameter(1);
c2->cd(2);
c2->GetPad(2)->SetGridx();
c2->GetPad(2)->SetGridy();
TArrayD aDpp(nfound-2);
TArrayD aDppErr(nfound-2);
Double_t mean_dpp = 0.;
for(int a=0; a<nfound-2; ++a){
aDpp[a] = aMean[a+1]-aMean[a];
aDppErr[a] = aMeanErr[a+1]+aMeanErr[a];
mean_dpp += aDpp[a];
}
mean_dpp /= (nfound-2);
TGraphErrors* gDpp = new TGraphErrors(nfound-2,aNpeak.GetArray(),aDpp.GetArray(),xErr.GetArray(),aDppErr.GetArray());
gDpp->SetMarkerStyle(22);
gDpp->SetTitle("Delta peak to peak distribution");
gDpp->GetXaxis()->SetTitle("#p.e.");
gDpp->GetYaxis()->SetTitle("ADC channels");
gDpp->Draw("ap");
gDpp->Fit("pol1","","same",0.,nfound-3);
gDpp->GetYaxis()->SetRangeUser(mean_dpp-50,mean_dpp+50.);
c2->cd(3);
c2->GetPad(3)->SetGridx();
c2->GetPad(3)->SetGridy();
TGraphErrors* gConst = new TGraphErrors(nfound-1,aNpeak.GetArray(),aConst.GetArray(),xErr.GetArray(),aConstErr.GetArray());
gConst->SetMarkerStyle(22);
gConst->SetTitle("Gaussian Normalization par distribution");
gConst->GetXaxis()->SetTitle("#p.e.");
gConst->GetYaxis()->SetTitle("#Entries");
gConst->Draw("ap");
TF1 *poisson = new TF1("poisson","[0]*TMath::Power(([1]/[2]),(x/[2]))*(TMath::Exp(-([1]/[2])))/TMath::Gamma((x/[2])+1.)", 0, nfound);
poisson->SetParameters(1.e6, 9., 2.);
poisson->SetNpx(4096*2);
gConst->Fit(poisson,"R","same",0.,nfound-2);
c2->cd(4);
c2->GetPad(4)->SetGridx();
c2->GetPad(4)->SetGridy();
TGraphErrors* gSig = new TGraphErrors(nfound-1,aNpeak.GetArray(),aSig.GetArray(),xErr.GetArray(),aSigErr.GetArray());
gSig->SetMarkerStyle(22);
gSig->SetTitle("Gaussian Sigma par distribution");
gSig->GetXaxis()->SetTitle("#p.e.");
gSig->GetYaxis()->SetTitle("ADC channels");
gSig->Draw("ap");
gSig->GetYaxis()->SetRangeUser(0.,50.);
TF1* pol1 = new TF1("pol1","pol1");
pol1->SetParameters(20.,0.5);
gSig->Fit("pol1","","same",0.,nfound-2);
c2->cd(5);
c2->GetPad(5)->SetGridx();
c2->GetPad(5)->SetGridy();
TGraphErrors* gGamma = new TGraphErrors(nfound-1,aNpeak.GetArray(),aGamma.GetArray(),xErr.GetArray(),aGammaErr.GetArray());
gGamma->SetMarkerStyle(22);
gGamma->SetTitle("Gaussian Gamma par distribution");
gGamma->GetXaxis()->SetTitle("#p.e.");
gGamma->GetYaxis()->SetTitle("ADC channels");
gGamma->Draw("ap");
c2->cd(6);
c2->GetPad(6)->SetGridx();
c2->GetPad(6)->SetGridy();
TGraphErrors* gASymm = new TGraphErrors(nfound-1,aNpeak.GetArray(),aASymm.GetArray(),xErr.GetArray(),aASymmErr.GetArray());
gASymm->SetMarkerStyle(22);
gASymm->SetTitle("Gaussian ASymm par distribution");
gASymm->GetXaxis()->SetTitle("#p.e.");
gASymm->GetYaxis()->SetTitle("ADC channels");
gASymm->Draw("ap");
return 0;
}
For the gain you seem to take the amplitude of the response. That is only correct if the
shape is constant. Better to take the integral of the function and in case of a ghost peak,
add that one too.