Dear Olivier
Thank you for investigating my problems, I hope you had nice holidays.
Maybe I should give you some background so that you can understand my intended use of the plots:
Let me use breast cancer as an example. In order to find new treatments people are interested to know which genes
are specifically active in breast tumors but not in normal breast tissue. For this purpose people use today the
so-called “DNA-chips” which contain gene fragments of all human genes on a slide (1cm x 1cm), onto which either
all genes active in the tumor or all genes active in normal tissue are spotted. A laser scanner is scanning the
DNA-chip and (in theory) only those genes on the chip will give a signal which are active in the tissue. However,
the data are really very noisy for many reasons. Thus in order to get a better statistics, people use samples
from e.g. 20 normal breast tissues and from 20 breast tumor tissues, which results in data from 40 DNA-chips.
Since you now need to find “differentially active” genes in a table consisting of 40 columns (samples) and more
than 25,000 rows (genes), which is in principle impossible, most statistics labs worldwide became interested in
this problem and have developed many new algorithms with the task to minimize false positives. The standard
statistics language for this purpose became R ( cran.r-project.org/ ) with a special section, called
“Bioconductor” ( bioconductor.org/ ) containing only R-packages used for DNA-chip analysis.
One of these packages is my package “xps”, which is based on ROOT, see:
bioconductor.org/packages/2.2/bioc/html/xps.html
In order to get a first impression about the quality of the data, people routinely use boxplots, see:
stat.ethz.ch/R-manual/R-patched/ … xplot.html
en.wikipedia.org/wiki/Box_plot
In addition, some labs also use the commercial program “Spotfire Decisionsite”, see:
spotfire.tibco.com/products/deci … alysis.cfm
which contains also parallel coordiantes, called “profile plots”.
When I have seen class TParallelCoord in ROOT I was really excited, because it contains both “profile plots”
and “boxplots”, and in addition the possibility to show the distribution of the data. (BTW, I do not quite
understand why you call the boxplots “candle charts” since this name is used mainly in the financial world).
The possibility to show boxplots and the distribution is in my opinion a real advantage when estimating the
quality of the DNA-chip data, since boxplots alone are often not sufficient to get a first impression about
the quality of the data, see also a real example on page 24 of vignette “xps.pdf” in my package, see:
bioconductor.org/packages/2. … oc/xps.pdf
As already mentioned boxplots are used to get a first impression of the quality of the raw data, but also
about the ability of different “normalization” methods to correct for differences in the raw data.
The breast cancer example above is a typical experimental setup, using between 20 and 60 samples, but people
often normalize raw data containing up to 500 samples, and they ROUTINELY use boxplots to evaluate the quality,
although they have to enlarge the width of the boxplots accordingly.
Thus my primary use of TParallelCoord will be the “candle” option to draw boxplots, but the ability to draw
histograms together with the boxplots is a major advantage compared to the R-function boxplot!
In summray, I really intend to use it that way!!! and it is a great option!!!
Sadly, TParallelCoord has an even more severe problem than the issues I have listed in my initial mail:
To understand this problem you need to know that the DNA-chips which are used by most labs do not contain
one gene fragment per gene on the chip, i.e. about 25,000 fragments, but 40 gene fragments per gene, i.e.
about 1.4 million gene fragments (=data points). The newst chips contain even 6.5 million gene fragments!
The problem with TParallelCoord is that for 1.4 million data it creates artifacts (and for 6.5 million data
it simply crashes.) In order to show you the problem of the artifacts I have updated my macro (see the
attached macro “macroParallelCoord.C”).
When you do:
.L macroParallelCoord.C
CreateFile("Plot6.root", 6, 100000)
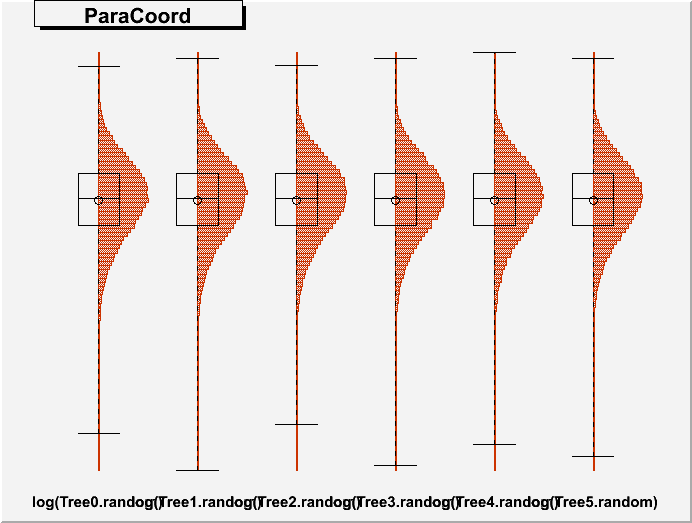
DrawParallelCoord("Plot6.root", "*", "random", 0, 0, kTRUE, kTRUE, kTRUE)
DrawParallelCoord("Plot6.root", "*", "random", 0, 0, kTRUE, kTRUE, kFALSE)
everything is ok, see the attached figure “Plot6log.png”.
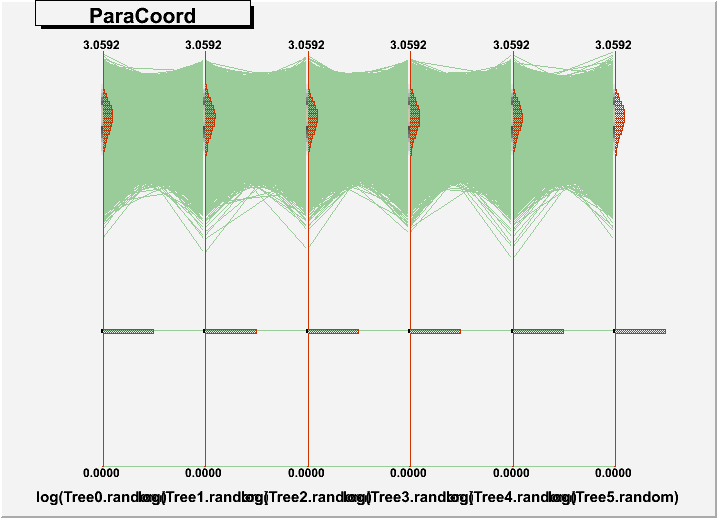
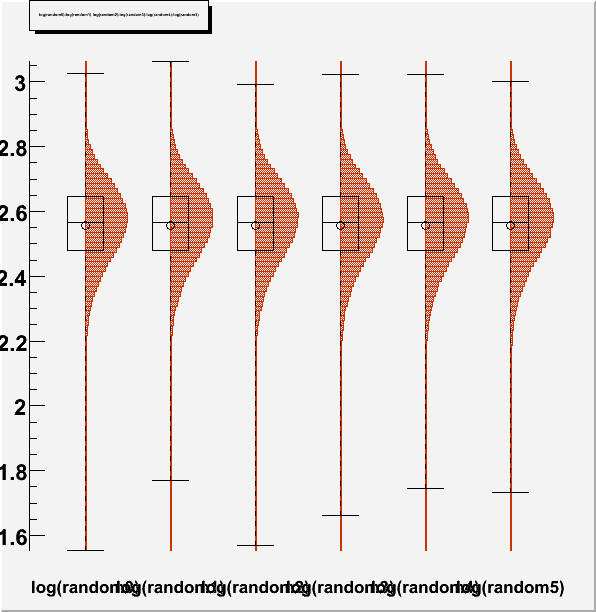
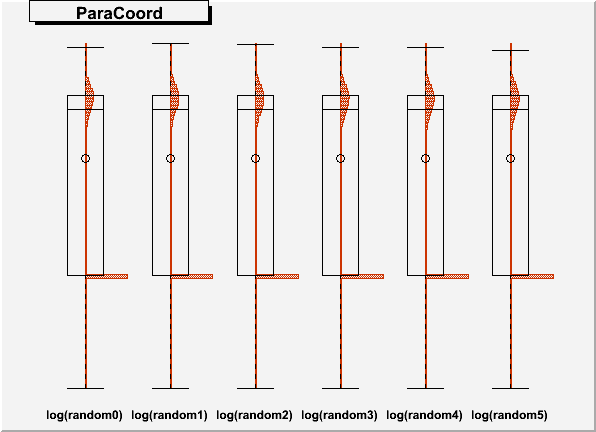
However, when you do:
.L macroParallelCoord.C+
reateFile("Plot6M.root", 6, 1500000)
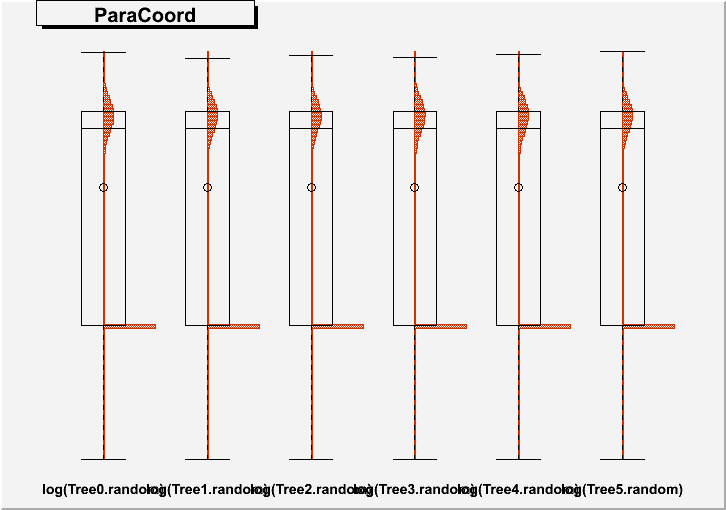
DrawParallelCoord("Plot6M.root", "*", "random", 0, 0, kTRUE, kTRUE, kTRUE)
DrawParallelCoord("Plot6M.root", "*", "random", 0, 0, kTRUE, kTRUE, kFALSE)
you get an artifact, which creates a wrong boxplot, see figures “Plot6Mlog.png” and “Plot6Mloghist.png”.
Due to the severity of this problem, i.e. compared to R boxplots people will get wrong boxplots, I would
appreciate if you would consider this problem to be of the highest priority.
(The crash with 6.5 million data is probably due to memory problems. R boxplots are able to hanlde this case,
but need machines with at least 16GB RAM.)
Thank you in advance.
Best regards
Christian
macroParallelCoord.C (5.4 KB)