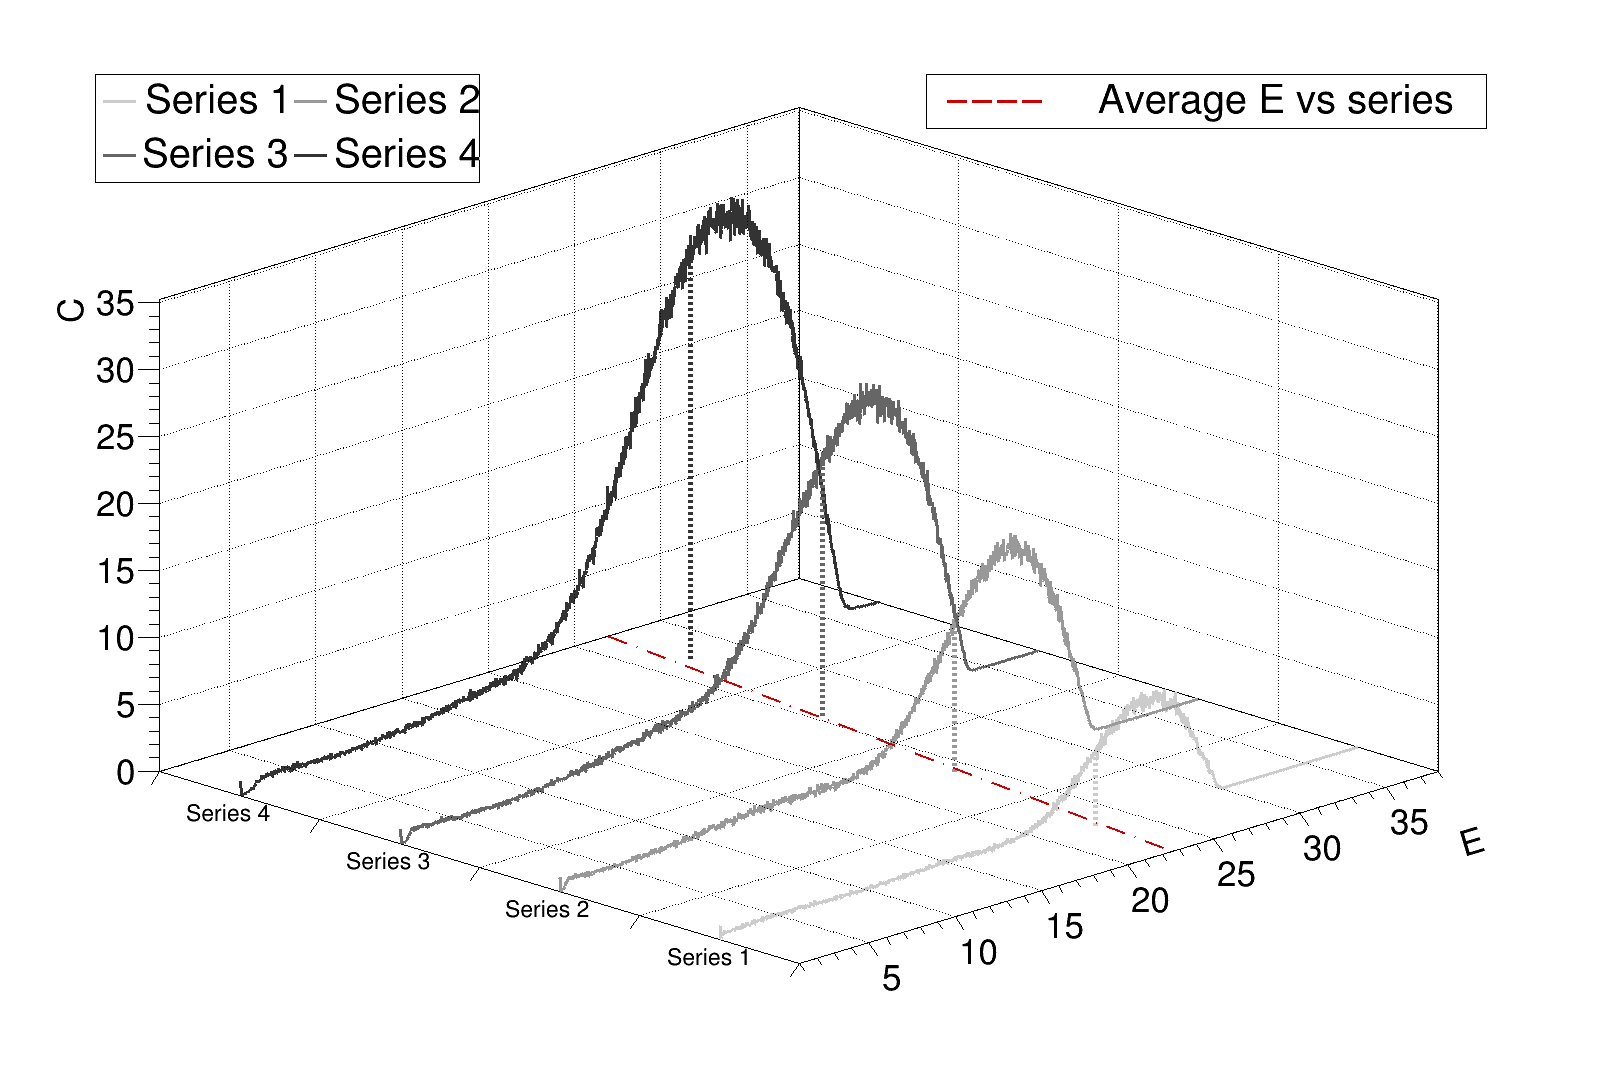
the axis title, axis sizes, and title offsets for the x-axis and y-axis,
For the third axis size of the series titles.
For 1: GetXaxis and SetTitle properties are not getting updated. I have gPad-> Update(); after Draw.
For 2: No idea how to do it.
I think point 1 is not so important, because you can read the X and Y axis stuff. But it is very difficult to read the series titles. Any idea about how to do it?
Thanks for your time,
A
For x and y make sure you do the formatting after drawing the graph.
Edit: I just noticed that this does not work even in the simple example of TMultiGraph documentation (lines 69-103 of https://root.cern.ch/doc/master/TMultiGraph_8cxx_source.html). SetRangeUser works, but other things like CenterTitle() or SetLabelSize(), etc. don’t seem to have any effect (with or without GetHistogram()).
Edit 2: corrected the line numbers of the root example I mention.
Seems like the “3d” option for TMultiGraph is causing this, but maybe an expert or developer can provide more insight. What I tried is just copying the lines I mentioned in my previous post into a new macro and added things like this:
mg->GetXaxis()->CenterTitle(); // or mg->GetHistogram()->GetXaxis()->CenterTitle();
at various points before or after the Draw line (L.98), and they had no effect (also tried adding more gPad “update” and “modified” in between).
There is this page on how to report a bug: https://root.cern.ch/guidelines-submitting-bug
To submit it I think you need another account somewhere, which I don’t have but you can have a look.
As for changing the third axis title size, I haven’t found an option for that.
The 3D option for graphs in painted in this method.
The axis are painted automatically with an internally created histogram called “frame”.
Its attributes cannot be changed by user’s program .