Plot mean and max values of TGraphs in a TMultiGraph

ROOT Version: 6.14
Platform: MacOS

Hello,

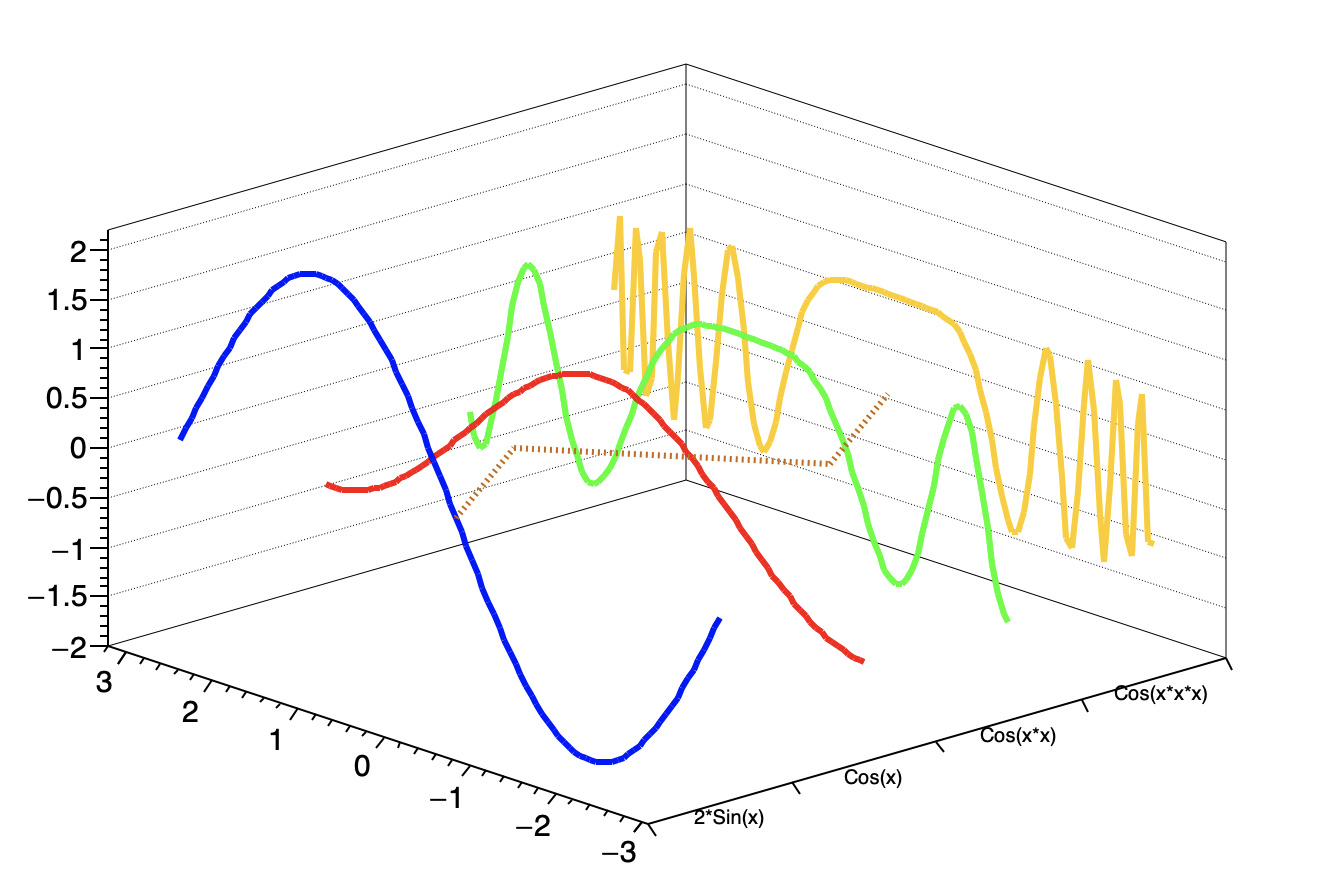
I am trying to recreate a plot similar to the one attached. I can use TMultiGraph to plot the 6 TGraph s I have. But I am kind of stuck in trying to figure out how I can plot the mean values and max values (for x-axes of each TGraph) of each TGraph s.

Is there any example I can use to do these tasks?

Thanks for your time,
A

Basically you want to plot that line in 3D linking the mean values ?

You can add a 3d line as follow:

{
   auto c0 = new TCanvas("c1","multigraph L3",200,10,700,500);

   auto mg = new TMultiGraph();

   auto gr1 = new TGraph(); gr1->SetLineColor(kBlue);
   auto gr2 = new TGraph(); gr2->SetLineColor(kRed);
   auto gr3 = new TGraph(); gr3->SetLineColor(kGreen);
   auto gr4 = new TGraph(); gr4->SetLineColor(kOrange);

   Double_t dx = 6.28/100;
   Double_t x  = -3.14;

   for (int i=0; i<=100; i++) {
      x = x+dx;
      gr1->SetPoint(i,x,2.*TMath::Sin(x));
      gr2->SetPoint(i,x,TMath::Cos(x));
      gr3->SetPoint(i,x,TMath::Cos(x*x));
      gr4->SetPoint(i,x,TMath::Cos(x*x*x));
   }

   mg->Add(gr4); gr4->SetTitle("Cos(x*x*x)"); gr4->SetLineWidth(3);
   mg->Add(gr3); gr3->SetTitle("Cos(x*x)")  ; gr3->SetLineWidth(3);
   mg->Add(gr2); gr2->SetTitle("Cos(x)")    ; gr2->SetLineWidth(3);
   mg->Add(gr1); gr1->SetTitle("2*Sin(x)")  ; gr1->SetLineWidth(3);

   mg->Draw("a fb l3d");
   double xl[4] = {0.5,1.5,2.5,3.5};
   double yl[4] = {0.,1,-1,0};
   double zl[4] = {0.,0.,0.,0.};
   TPolyLine3D *pl3 = new TPolyLine3D(4, xl, yl, zl);
   pl3->SetLineColor(kOrange+2);
   pl3->SetLineWidth(3);
   pl3->SetLineStyle(3);

   pl3->Draw();
}

The means will be the y vector.

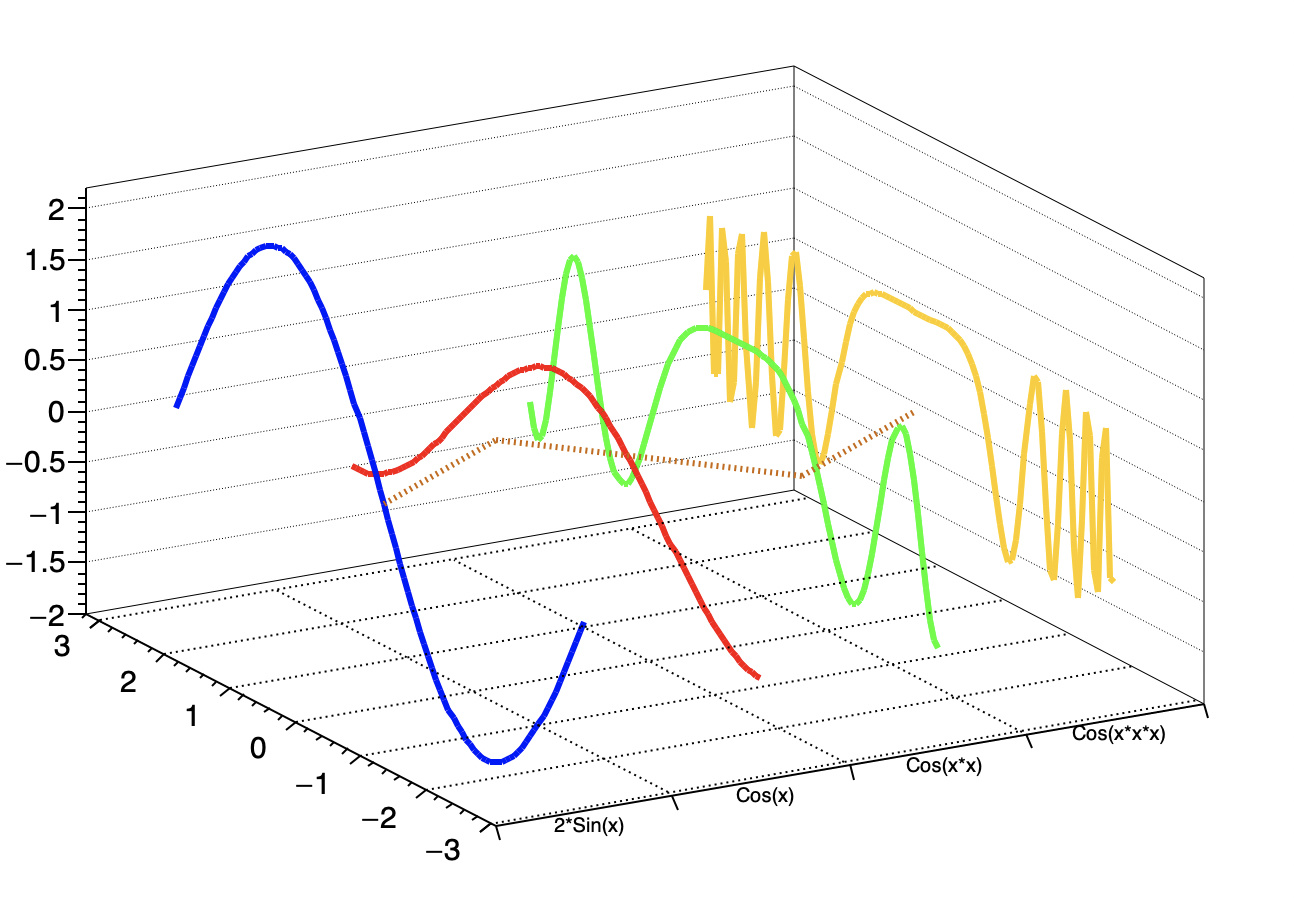
Ah, that is what I wanted. I will make two such 3D lines, one for mean values and other for max values.

Thanks a lot. I was about to add a second figure to show the relationship of the distributions with the mean and max values. This will save me some space. Thanks again.

BTW, do you know, if we can make a 3D grid through out our axis system? If not, it is fine.

Thanks,
A

1 Like

There is not setting to have the grid on a 3D plot like that.
But it can be easily drawn with 3D lines too.

void multigraph3D()
{
   auto C = new TCanvas("C","C",200,10,700,500);

   auto mg = new TMultiGraph();

   auto gr1 = new TGraph(); gr1->SetLineColor(kBlue);
   auto gr2 = new TGraph(); gr2->SetLineColor(kRed);
   auto gr3 = new TGraph(); gr3->SetLineColor(kGreen);
   auto gr4 = new TGraph(); gr4->SetLineColor(kOrange);

   Double_t dx = 6.28/100;
   Double_t x  = -3.14;

   for (int i=0; i<=100; i++) {
      x = x+dx;
      gr1->SetPoint(i,x,2.*TMath::Sin(x));
      gr2->SetPoint(i,x,TMath::Cos(x));
      gr3->SetPoint(i,x,TMath::Cos(x*x));
      gr4->SetPoint(i,x,TMath::Cos(x*x*x));
   }

   mg->Add(gr4); gr4->SetTitle("Cos(x*x*x)"); gr4->SetLineWidth(3);
   mg->Add(gr3); gr3->SetTitle("Cos(x*x)")  ; gr3->SetLineWidth(3);
   mg->Add(gr2); gr2->SetTitle("Cos(x)")    ; gr2->SetLineWidth(3);
   mg->Add(gr1); gr1->SetTitle("2*Sin(x)")  ; gr1->SetLineWidth(3);

   mg->Draw("a fb l3d");
   double xl[4] = {0.5,1.5,2.5,3.5};
   double yl[4] = {0.,1,-1,0};
   double zl[4] = {0.,0.,0.,0.};
   auto *pl3 = new TPolyLine3D(4, xl, yl, zl);
   pl3->SetLineColor(kOrange+2);
   pl3->SetLineWidth(3);
   pl3->SetLineStyle(3);

   pl3->Draw();

   // Draw grid
   for (double yg=-3; yg<=3; yg++) {
      auto *lg3 = new TPolyLine3D(2);
      lg3->SetLineStyle(3);
      lg3->SetPoint(0,0,yg,-2);
      lg3->SetPoint(1,4,yg,-2);
      lg3->Draw();
   }
  for (double xg=1; xg<=3; xg++) {
      auto *lg3 = new TPolyLine3D(2);
      lg3->SetLineStyle(3);
      lg3->SetPoint(0,xg,-3,-2);
      lg3->SetPoint(1,xg,3,-2);
      lg3->Draw();
   }
}

1 Like

Interesting. I am definitely going to try this. Thanks a lot for all your help.

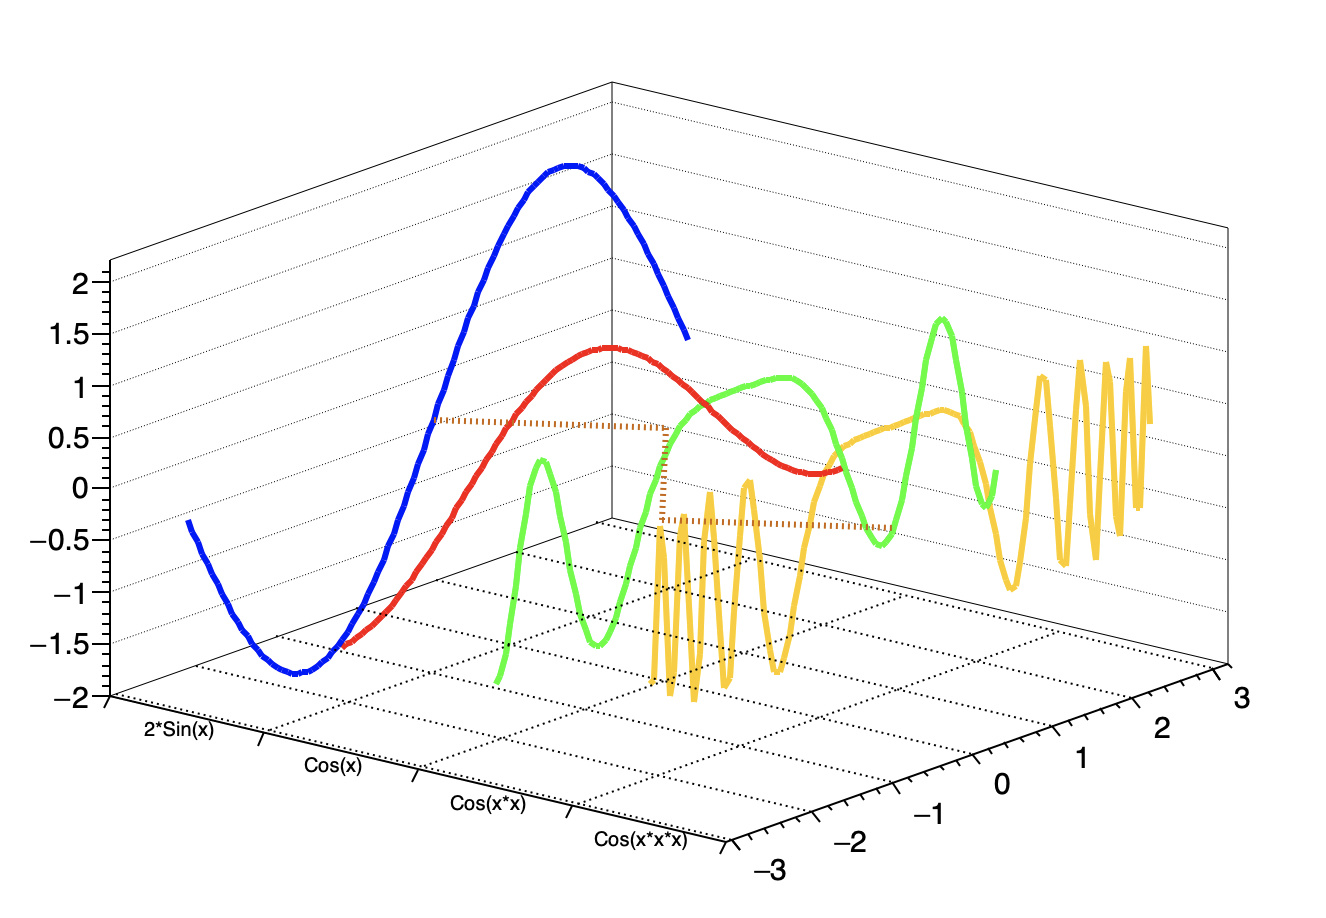
Sorry to revive this topic again. But I am trying to figure out a way to “reverse” the x-axis. So in the given example, have -3 to 3 from the left to the right. I tried deleting the axis and insert a new one, but the new one goes in the 2D way instead of 3D way. Any tips?

Thank you for your time!

May be just rotate the plot:

1 Like

Is there any way to write the “rotation” in your .C file? The reason I ask is, I am going to have a few such plots, and I want to make sure they all have the same the same angle.

Thanks a lot for all your help.

Nevermind, I figured it out.

TMultigraph (or any other pad), can be rotated by using “gPad-> SetTheta(30);” and “gPad->SetPhi(30);”.

Thank you very much for your help.

1 Like

Is it me, or does TMultigraph does not allow inserting TLatex? I am trying to put the equation of the line fit I have for average values. But, the latex text is not showing up on my canvas. TLatex is taking only two coordinates- I am providing x and y coordinates, I get an error, when I try to provide the z coordinate as well.

Any idea how to insert latex text in TMultigraph 3D?

Thanks a lot for your help.

See how it is done is this example:

https://root.cern/doc/master/annotation3d_8C.html