Using this method can indeed solve the fluctuation and abnormal point problem. That’s the result that I have switched off the straggling.

I’m still looking for a proper fix, but in the mean time please use this workaround: replace the line
tr.SetClustersMaximum(50);
by
tr.SetTargetClusterSize(1);
Looks good.
Hi,
Thanks a lot for your reply
So is that ok now? Just decrease the cluster size to one electron?
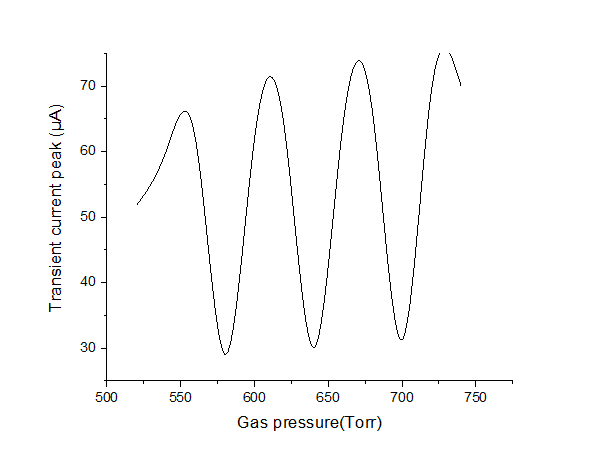
So why the code tr.SetClustersMaximum(50) can eliminate the fluctuation in all the gas pressure but has the opposite curve trend.
However the code tr.SetTargetClusterSize(1) using the TrackSrim method is almost the same as the TrackTrim method.
You seem to have a parallel-plate geometry (constant electric field and weighting field) so each electron along the track generates a constant induced current while it drifts in the gas. And you have discrete starting points of the electrons along the track.
By the way, if you really have a parallel-plate geometry there is really no point in using a finite-element field map. It’ll be much easier/faster if you use ComponentConstant (or ComponentAnalyticField).
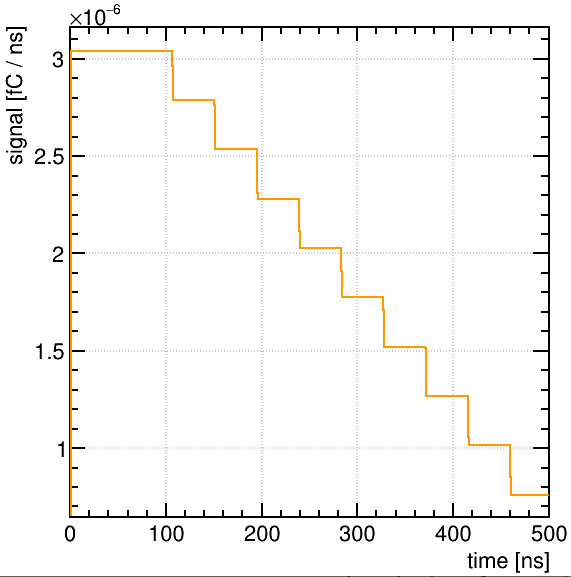
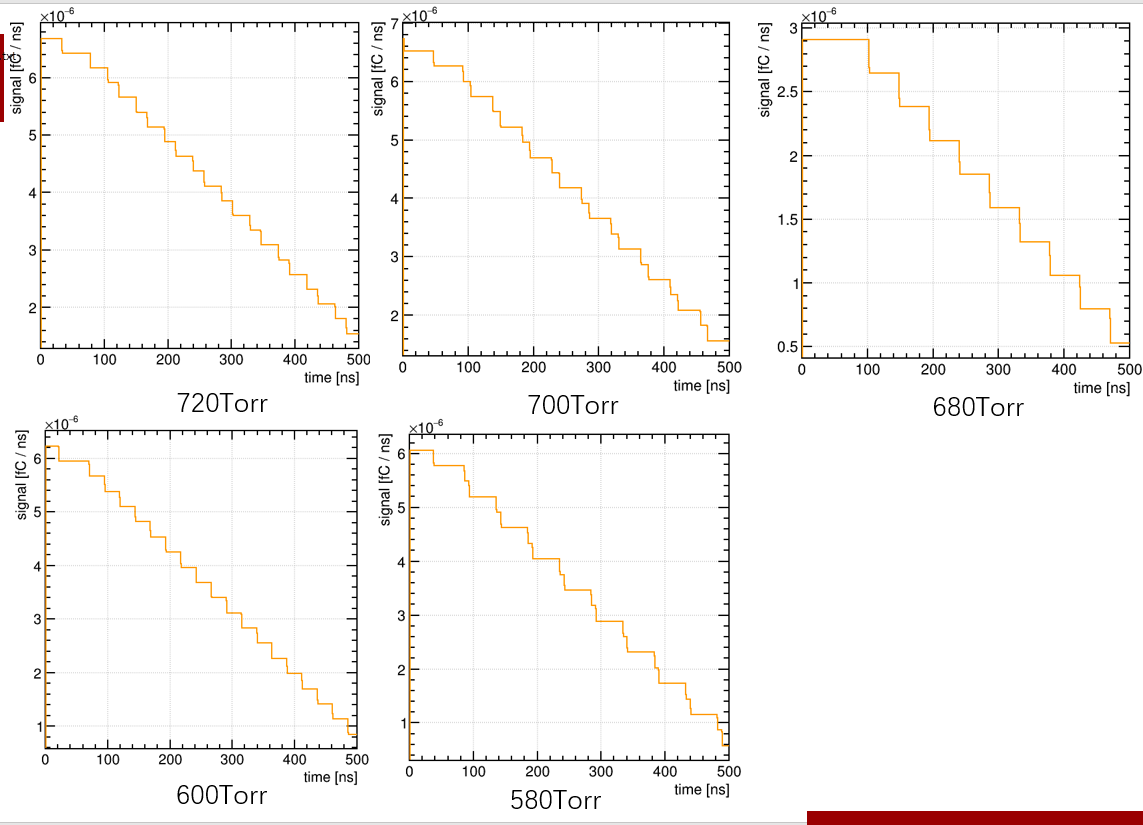
You mean the plot labelled “680 Torr”? It does look a bit strange.
You should have two effects when you change the pressure: with increasing pressure the number of electron/ion pairs created in the gas will increase. But at the same time, if you use the same electric field the drift velocity will also change (to first order the drift velocity scales with E/p).
Hi
Thanks a lot for your reply and help
It is not just a simple parallel-plate geometry, but a little bit complex parallel-plate geometry which include holes ,grooves,filleted corner and so on. Can that also use the ComponentConstant (or ComponentAnalyticField)?
So why some of curve is zigzag , some is columnar,and some is like a pulse signal?
Yep, I don’t simulate all of the gas pressure, maybe it is not only at the 680 Torr point but a range pressure around it .
Besides , How to display the E/P value and drift velocity through the code? I agree with what you said about the two effects, I want to do some research on it.
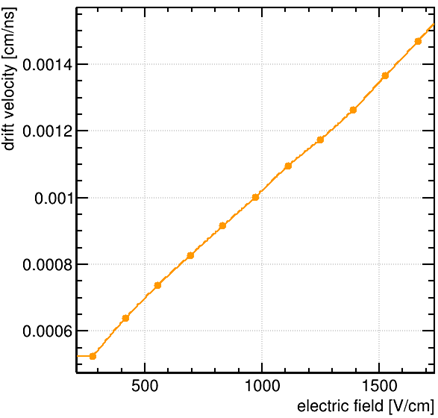
You can use a script like this
to plot the drift velocity as function of the electric field.

Hi,
I am very confused now and even don’t know whether my simulation is right during the nearly half of years learning,which depress me a lot. why should we choose the TrackSrim instead of the TrackTrim? Is the because using the TrackSrim method can switch off the straggling and reduce the fluctuation , which tends to the deposited energy simulation but not the transportation of the proton . Is that right?
Hi,
Would you please tell me how to get the electron drift velocity value? not the one like this
because once the voltage is set ,the electric field is constant, I want to get the drift velocity at different gas pressure. the X-coordinate would change to V/cm•p
Can you please provide the SRIM output files you are using?
There is no predefined function for that. You can retrieve the values of the drift velocity stored in the gas table using something like that:
and then make a plot yourself.
740Srim-He.txt (9.1 KB)
720Srim-He.txt (9.1 KB)
700Srim-He.txt (9.1 KB)
680Srim-He.txt (9.1 KB)
660Srim-He.txt (9.1 KB)
580Srim-He.txt (9.1 KB)
640Srim-He.txt (9.1 KB)
620Srim-He.txt (9.1 KB)
600Srim-He.txt (9.1 KB)
560Srim-He.txt (9.1 KB)
540Srim-He.txt (9.1 KB)
540Srim-He.txt (9.1 KB)
Hi,
Thanks a lot for your reply and help
The SRIM output files are theses in the above, thanks again for helping me solve the problem.