Thanks, Why is that?
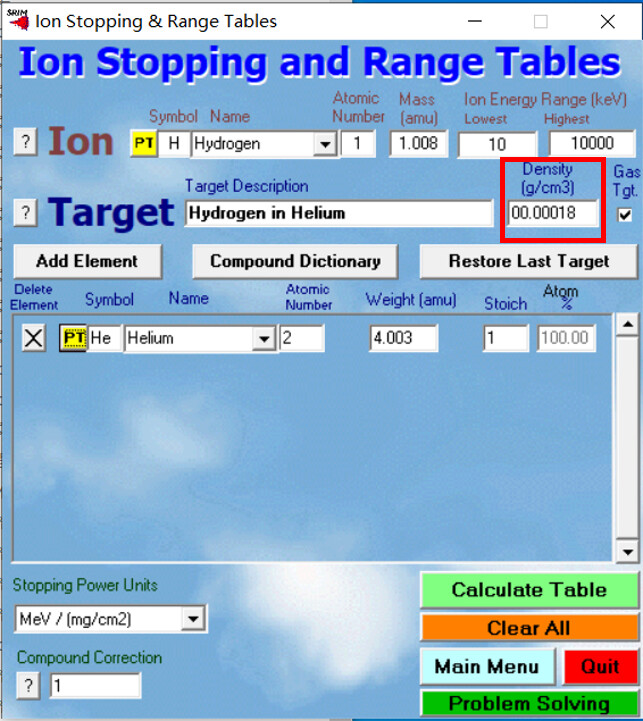
Why can’t I choose MeV/mm?
Because at the moment TrackSrim only accepts MeV/(mg/cm2). I can put it on my to-do list to modify the class such that it also accepts other units, but for now the easiest solution is just to select MeV/(mg/cm2) in SRIM.
HI,
I have switched off the straggling and got the induced current like this.
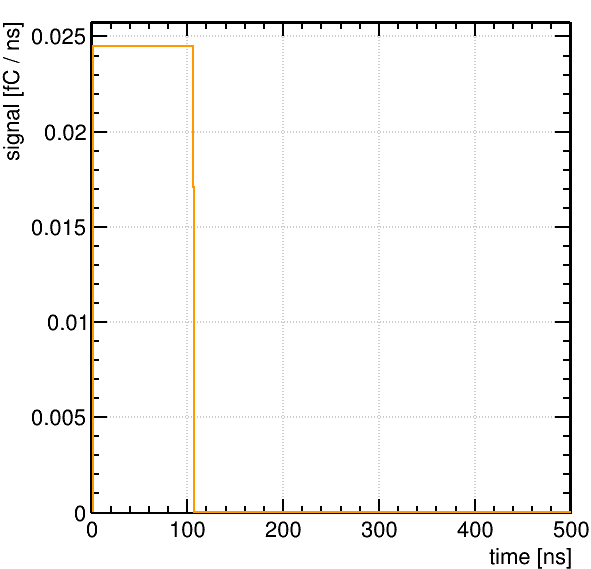
There are some questions confused me a lot.
The plot below is the result I did not switch off the straggling.
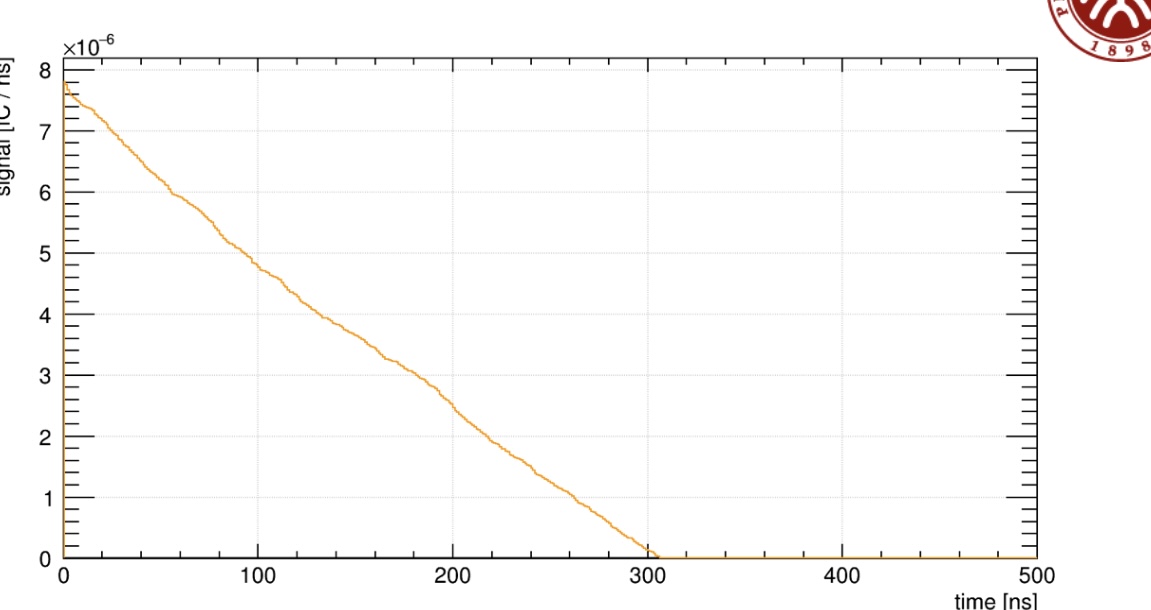
1,So why the shape of them are different? Is that the reason for switching off the straggling?
2,Why the time is different too!
3,Why the induced current without straggling is bigger than the one has the straggling?
4,the histogram means that during the time about 100 ns, the induced current is always 0.025 μA。Is that right? or the induced current without straggling is just an average value during the 100ns not the transient current each time
That’s really strange. There is an order of magnitude difference between the two signals.Can you please provide minimal working examples that reproduce these plots?
switch off the straggling code.C (4.1 KB)
the original code.C (3.8 KB)
Hi,
Thanks a lot for your reply.
These are the codes, please help me to see what’s the problem.
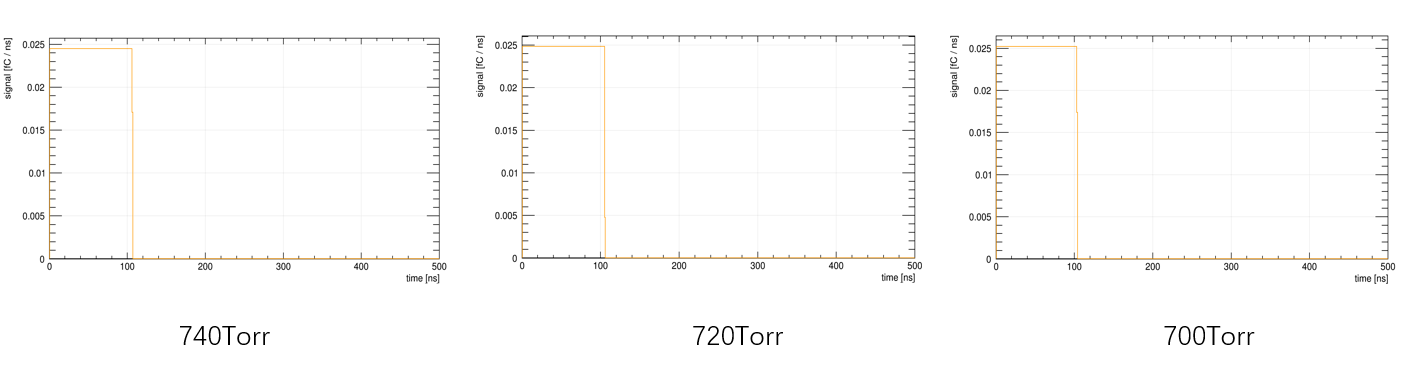
Hi, there are some new findings after I have switched off the straggling. The simulation results show that the induced currents Increase as the air pressure decrease.Apparently the result is not reasonable, and is stranger than before.
Hi,
I find that no matter how the TrackSrim.txt and gas files change under different gas pressure, the Average number of electron/ion pairs are always 96662, which is very huge. Does that mean the one tracks can cause 96662 pairs of electron/ion?
Hi,
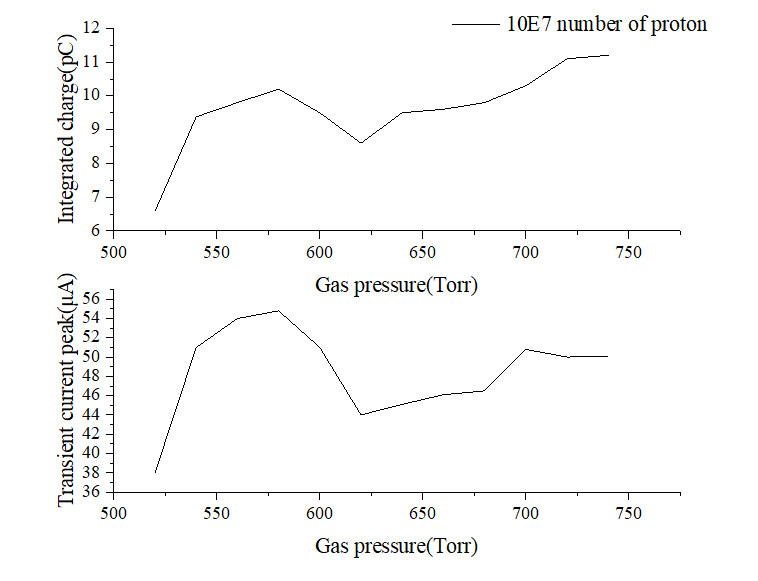
I still find that after I have switched off the straggling, the abnormal point from 540Torr to 640Torr in the curve below which I simulated without switching off the straggling before will disappear. The new curve between the gas pressure and induced current is a linear proportional relationship, with every drop in pressure, the induced current increases.
Thank you. Please also provide the gas file and the SRIM file.
I don’t know if it’s reasonable or not. Did you use the same field map for all pressures?
Hi,
Thanks a lot for your help
Yep,I use the same field map for all the pressure. The two codes have very different results and tendency, and I don’t know why.
740Srim-He.txt (9.1 KB)
Hi,
That’s the SRIM file, the gas file is limited to upload, I have send it to your email, and please help me to take a look to find the reason. Thanks a lot!
Hi,
I think about the reason for why there is an order of magnitude difference between the two signals and the tendency of the current curve. Maybe the main reason is in the EXYZ files which had been set the layer width to 10mm , the detector thickness I think, but in the Srim files there are no parameters set like this.
Hi,
no, there is something going wrong with TrackSrim. I’m taking a look…
Yes, that’s fine. The problem is in the TrackSrim class, not the SRIM output file.
Hi,
Thanks a lot for your reply and help
So does that can be solved? or should I choose another method?