I’ve seen many replies that actually do not solve the problem apparently since ROOT3.
Bottom line, I have not yet seen a solution. I’ll describe the situation.
I have a TH1 in a root file.
TFile* file=…
TH1* dummyhist=(TH1*)file->Get(…);
Now, this dummy histogram has values from -15000 to 50000, but I only care about seeing 0 to 3000.
I’ve tried
dummyhist->GetXaxis()->SetRange/SetRangeUser (nothing)
dummyhist->GetXaxis()->SetLimits (label changes but not the position of actual values).
I cannot think of a way to resolve other than to redeclare:
TH1* dummy2=new TH1(“contents and binning as demanded”)
for… fill dummy 1 elements into dummy 2 with significant over/underflow
Does anyone have real a solution for this?
_ROOT Version:6.14.0. Platform: Not Provided Compiler: Not Provided
The following works for me, right after opening hsimple.root on ROOT 6.16.00
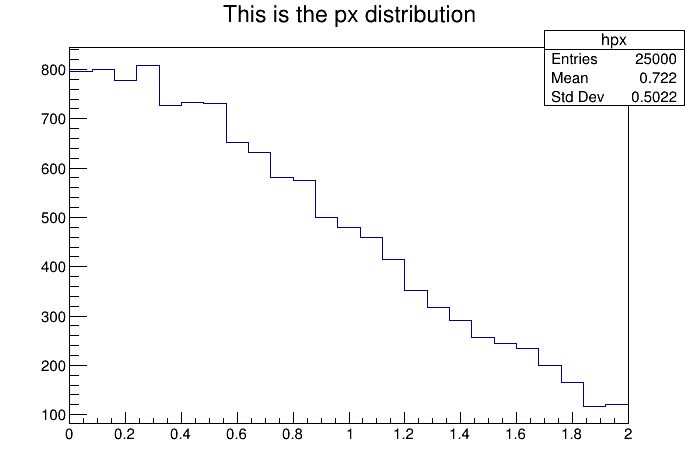
root [1] hpx->Draw()
Info in <TCanvas::MakeDefCanvas>:  created default TCanvas with name c1
root [2] hpx->GetXaxis()->SetRangeUser(0,2)
root [3] gPad->Modified()
root [4]
Note that before doing gPad->Modified() you don’t see the changes.
Having said that, I have also found cases when no matter how many Modifieds or Updates on pads or canvases, the axis doesn’t change, so I’m not very sure what’s going on
Thank you dastudillo.
I am half-successful with this method. I don’t know why but the histogram shifts 0 just fine, but the upper range seems limited to the maximum of the data.
I’m pretty sure you can’t SetRange(User) beyond the range of actual bins in the histogram. The reasoning could be that that would misrepresent the under/overflow bin contents. If you want a very “zoomed out” view you need to make a histogram with bins that go as far as you want to see.
FWIW: I usually make my histograms with a much larger range than necessary, and later constrain the range to only have the bins which have nonzero content. The TH1 methods “FindFirstBinAbove” and “FindLastBinAbove” are useful for this.
I’m currently using what I call a ghosthist method
TF1* ghosthist= new TF1(“ghost”, range that I want);
ghosthist->SetTitle(dummyhist->GetTitle() )
… Take out the properties
ghosthist->Draw();
dummyhist->Draw(“same”);