Hi Root family.
I have a 2D Histogram and I want to set a specific range for the plot.
I was following this post
but I want an “irregular” range. I mean I want to have the range of:
Y< -Pi/2 and Y>Pi/2
my plot is between -Pi to Pi in the Y axis
My question is how I can do that?
Cheers,
Manuel
Please read tips for efficient and successful posting and posting code
ROOT Version: Not Provided
Platform: Not Provided
Compiler: Not Provided
ferhue
2
Assuming your TH2* variable is called h2 and that you are using C++, then:
h2->GetXaxis()->SetRangeUser(-TMath::Pi()/2,TMath::Pi/2);
h2->GetYaxis()->SetRangeUser(-TMath::Pi(),TMath::Pi);
Try:
your2Dhisto->GetYaxis()->SetRangeUser(-TMath::PiOver2(), TMath::PiOver2());
@Wile_E_Coyote and @ferhue
The option of GetYaxis()->SetRangeUser(-TMath::PiOver2(), TMath::PiOver2());
give me the range of -pi/2<Y<pi/2 and I want the outside range
pi>Y>pi/2 and -pi<Y<-pi/2 in the same plot
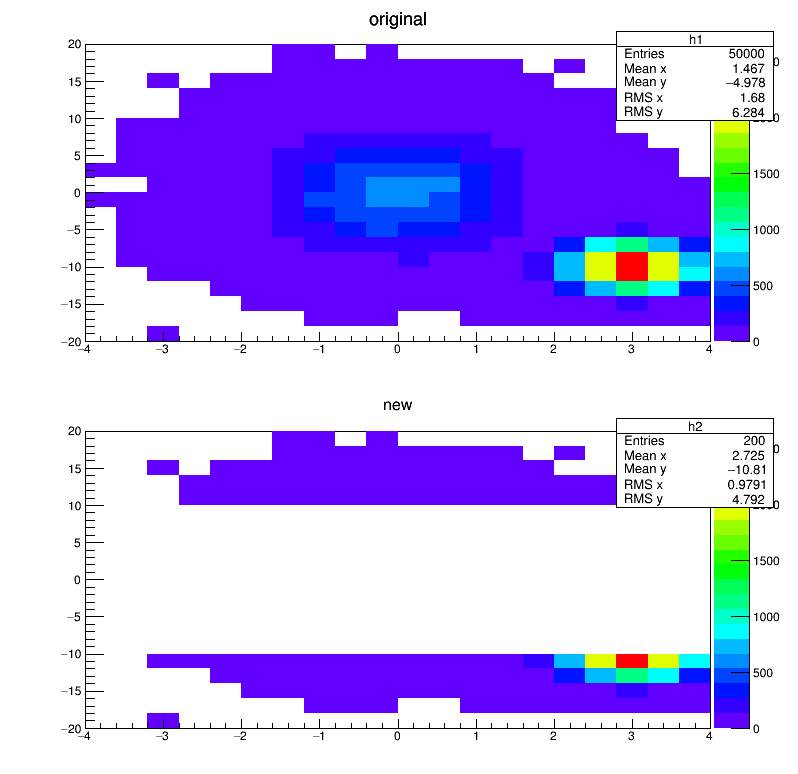
I think you have to make a new 2D histogram copying the contents of the original but without the y bins you want to exclude. Something like
   TCanvas *c1 = new TCanvas("c1","c1",1000,1000);
   c1->Divide(1,2);
   int nbinx=20, nbiny=20;
   TH2F *h1 = new TH2F("h1","original",nbinx,-4,4,nbiny,-20,20);
   float px, py;
   for (Int_t i = 0; i < 25000; i++) {
      gRandom->Rannor(px,py);
      h1->Fill(px,5*py);
      h1->Fill(3+0.5*px,2*py-10.);
   }
   TH2F *h2 = new TH2F("h2","new",nbinx,-4,4,nbiny,-20,20);
   for (Int_t j=1; j<=nbiny; j++) {
     if (abs(h1->GetYaxis()->GetBinCenter(j))<10) continue;  // y-range to exlude
     for (Int_t i=1; i<=nbinx; i++) {
       h2->SetBinContent(i,j,h1->GetBinContent(i,j));
     }
   }
   c1->cd(1);
   h1->Draw("colz");
   c1->cd(2);
   h2->Draw("colz");
couet
6
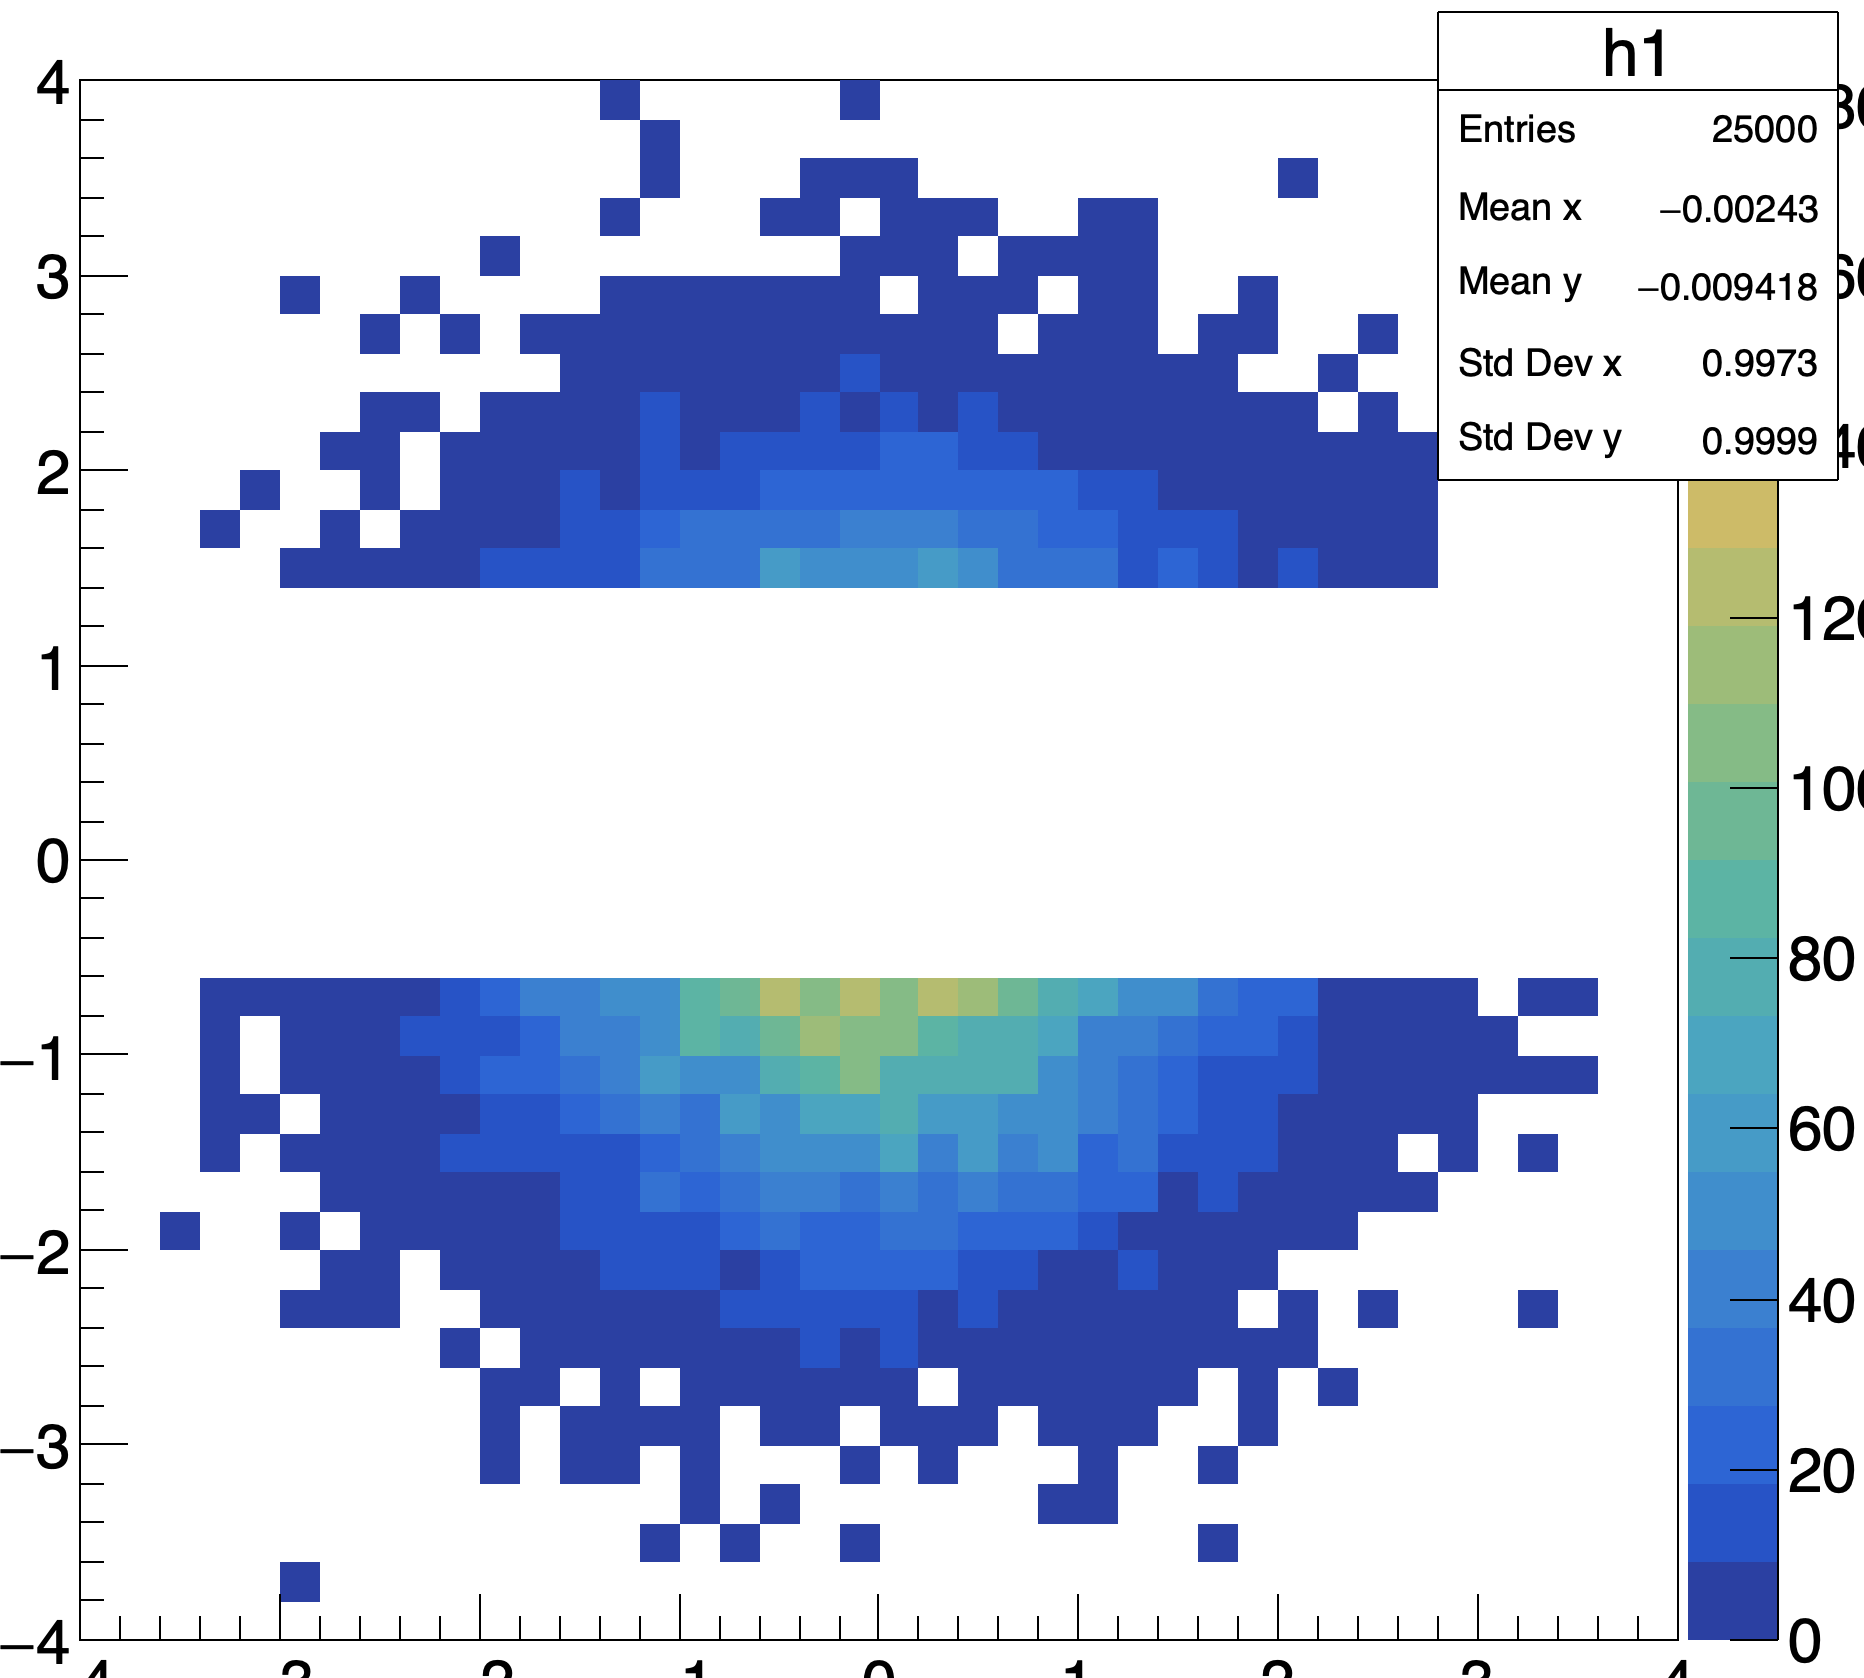
you can also define a CUTG.
{
   TCanvas *c1 = new TCanvas("c1","c1",1000,1000);
   int nbinx=40, nbiny=40;
   TH2F *h1 = new TH2F("h1","original",nbinx,-4,4,nbiny,-4,4);
   float px, py;
   for (Int_t i = 0; i < 25000; i++) {
      gRandom->Rannor(px,py);
      h1->Fill(px,py);
   }
   TCutG *cutg = new TCutG("CUTG",10);
   cutg->SetVarX("x");
   cutg->SetVarY("y");
   cutg->SetFillStyle(1000);
   cutg->SetPoint(0,3.972254,1.425641);
   cutg->SetPoint(1,-3.963006,1.364103);
   cutg->SetPoint(2,-3.972254,3.989744);
   cutg->SetPoint(3,3.990751,3.969231);
   cutg->SetPoint(4,3.981503,-4.010256);
   cutg->SetPoint(5,-4.009249,-3.979487);
   cutg->SetPoint(6,-3.981503,-0.5538461);
   cutg->SetPoint(7,3.963006,-0.5948718);
   cutg->SetPoint(8,3.972254,1.425641);
   cutg->SetPoint(9,3.972254,1.425641);
   h1->Draw("colz [CUTG]");
}
The points are not optimal in that example but that’s the idea.