I am trying to plot a 3D plot as shown on page 32 or 36 of the “Histograms.pdf”.
I try using options “BOX, SURF3, CONT3, glboxz, LEGO2…etc” and always get a scatter plot.
“3-D Histograms
By default a 3D scatter plot is drawn. If the “BOX” option is specified, a 3D box with a volume proportional to the cell content is drawn.”
I cannot produce such a plot to validate if this is a true statement.
Processing Th3DTry.C...
Error in <TFile::TFile>: file run_56515_skimmed_tripinc_0.root does not exist
Info in <TCanvas::MakeDefCanvas>:  created default TCanvas with name c1
root [1]
and receive an empty canvas. Not even a scatter plot.
Provide a running macro showing the problem.
Yes I saw you are running 5.30.
I am running 5.34
I ran your macro with this version (5.34), and get the plot I posted which is correct seems to me.
If you do not get the same, it means your version has a problem with this option, therefore it is too old.
Well only other version available is 5.32 and according to the .pdf file that states the changes made from 5.30 to 5.32, this should not be an issue, therefore it should not be “too old”.
Let me be a little more explicit in what I am trying to accomplish.
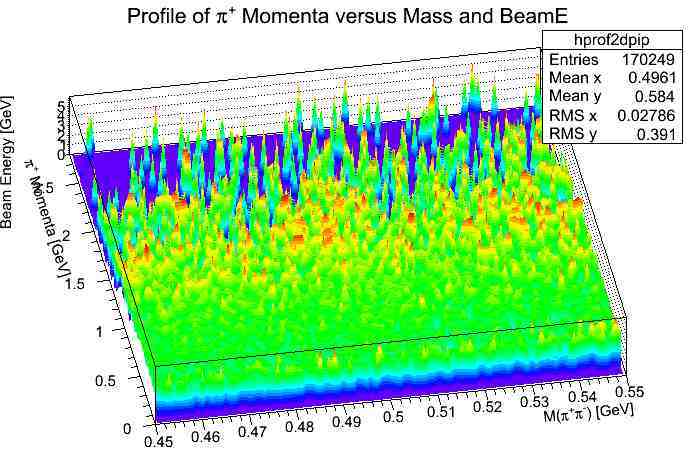
I have 3 variables which I believe have correlation. Plotting 2 of these variables and profiling it will not show the correlation. So I am trying to accomplish this by plotting a 3D histogram with some option to view this.
I have looked into using the glboxz and the glcolz, etc and I this does not produce a clear enough representation for analysis.
Now as my original post stated: "I am trying to plot a 3D plot as shown on page 32 or 36 of the “Histograms.pdf”.
As far as I am aware, 3-D histogram drawing supports only (page 28 in the “3Histograms.pdf” and http://root.cern.ch/root/html/THistPainter.html#HP01d):
hd3->Draw();
and:
hd3->Draw(“BOX”);
and:
hd3->Draw(“ISO”);
so, it makes no sense to try:
hd3->Draw(“lego2”);
[quote=“Pepe Le Pew”]As far as I am aware, 3D histogram drawing supports only (page 28 in the “3Histograms.pdf”):
hd3->Draw();
and:
hd3->Draw(“BOX”);
and:
hd3->Draw(“ISO”);
so, it makes no sense to try:
hd3->Draw(“lego2”);
I tried your macro on ROOT “5.28/00”, “5.28/00g”, “5.30/03” and “5.31/01”.
In all cases I get the same picture as Olivier.[/quote]
3D histogram also supports glcolz and glboxz which is not in “3Histograms.pdf”, so it made sense to try them all.
Regardless, it appears ROOT does not have the capability to produce the histogram I need for my analysis.
With the lastest macro I get the box plot as shown on the picture I sent.
So for me it is fine.
Can you sent the picture you get with the last macro you sent ? … if it is not a box plot either you are using a version which is too old or there is a bug on the platform you are running root.
I then stated the options I used and the described the output. The histogram that is produced by the macro is identical to the histogram produced by me. This representation is not what I am trying to analyze, I am trying to produced 3D histograms using 3 variables that plot like 3D plots on page 32 or 36 of “Histograms.pdf”.
NONE of the pictures on pages 32 and 36 in the “3Histograms.pdf” shows any 3-D histogram.
They ALL are 2-D histogram representations.
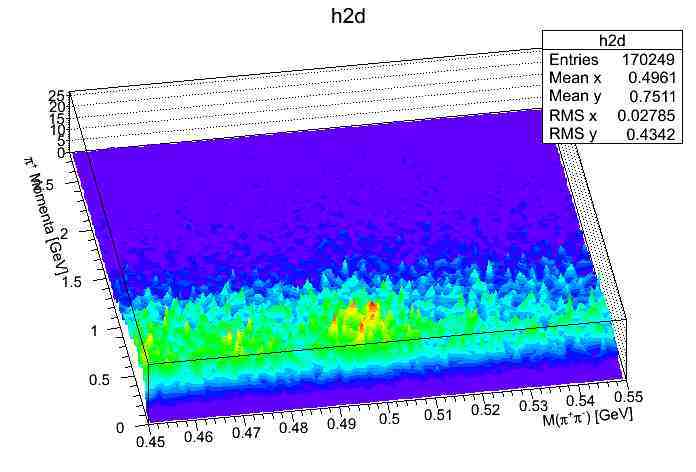
You would probably need to create a 2-D histogram in which “X” and “Y” axes will be the first 2 of your variables and the 3-rd variable will be the “bin-contents”.
This is true, I have over 40k data points, trying to use TGraph2D on 1500 data points ran overnight without results.
Also to remark of Pepe Le Pew post
My original post was asking for a method to reproduce such looking graphs using the 3D histogram, never did I seem to make it implied that the images on pages 32 and 36 were drawn using the 3D histogram, if it were that easy, this help request would not have been sent