The histograms on these pages ar 2D histograms… TH2 … not 3D (TH3) … we have told you several time …
Obviously you people do not read total postings, if you did maybe this would be solved by now.
I don’t know if its my English or yours, however as I have stated this many times, it seems you cannot comprehend, so I will state it again and again until it is understood.
Quoting my last post:
I never stated the histograms on those pages were 3D, I HAVE BEEN ASKING to produce graphs that look like such using the 3D option.
How hard is that to comprehend?
Can I please get assistance from someone or some people that can comprehend the task I am trying to accomplish.
I have stated a very clear task, with clear steps I have taken. I know they are clearly wrote because I have had a jury of peers review the log.
The last macro you sent, just makes that kind of plot nicely.
In that macro you plot a TH2 using SURF2 option.
The result looks like the plots you have on pages 32 and 36. So it is fine seems to me.
You also plot TProfile using SURF2. For TProfile it makes no sense to plot them using SURF2.
The last macro I sent would produce the plots of interest if the TProfile didnt convolute the spectrum.
I cannot analyze a plot with a concuted spectrum because of the sensitivity of the correlation.
I am lookIng for a way to produce the plot shown as 2d.jpeg with the z axis as the beam profile.
Hi,
What exactly would you like to do ? Do you know what a TProfile class does ?
If you want to plot the density as function of 3 variables you should use a TH3D and not a TProfile2D. The TProfile2D does not plot a density but the average of the 3-rd variable as function of the first two.
Lorenzo
Not to sound snide, you can read on what I am trying to do by read the top post of page 2, where I have uploaded plots and an explanation.
I understand what a TProfile does, I simply used it as an example in attempt to better have ROOT support understand my goal.
I cannot use a TH3 due to the fact that a TH3 has no option to view its contents as a color density plot.
I have attempted to use the glboxz and glcolz, but these also do not produce the desired plot.
Simply put, what I would like to do it make a plot of 3 variables and have it look like a surface (surf2) plot shown.
Michael
I also do not understand what you want. You say you want something like 2D hist, but you have 3D hist, but the picture is for 2D hist, but you want the same for 3D hist, but 3D hist is 3D hist, not a 2D hist, so everybody has to read your posts again, and … you want the same plot as for 2D hist, but for 3D hist and …
What type of plot you want? TH2 surf2 is a very primitive thing, it simply connects bin centers and Z value is defined by bin content. So, do not show this as an example, it’s for 2D case. What do you want?
Have you look at TGraphDelaunay, may be, it’s what you want? May be, you need a set of iso-surfaces?
If you have a surface, using 3D points, how do you define the colors on surface?
It would be good, if you can show non-ROOT plot (I think, we can find it on wikipedia) to better understand what you want.
For example:
mathgl.sourceforge.net/en/pictures.html
And try to be more polite.
(This reply is to the one you deleted)
I’m quite sure it is not me, since a committee of my peers understands this very well.
I do not see the issue in the concept.
I have 3 variables X, Y, Z. Not 4 (do not know how you got to 4, but I can address that later.)
Now I want to plot X and Y, with the intensity, density, (or however you wish to call it), as the Z variable.
Top of page 2 has a plot called 2D.jpeg…all I want is the Z axes to be another variable, and for it to be represented graphically looking like 2d.jpeg
I know the explanation on page 2 is sufficient and clear, and if this is the best support that is offered then just say “It can’t be done” and go about your day. I have been polite and if you think it is impolite, then don’t help.
Now for those that wish to help, I have tried using the “GLSURF” and “GLLEGO” options of a TH3 and receive the following errors
Error in <TGLPlotCoordinates::SetRangesCartesian>: Zero axis range.
Error in <TGLPlotCoordinates::SetRangesCartesian>: Zero axis range.
root [1] Error in <TGLPlotCoordinates::SetRangesCartesian>: Zero axis range.
Error in <TGLPlotCoordinates::SetRangesCartesian>: Zero axis range.
Error in <TGLPlotCoordinates::SetRangesCartesian>: Zero axis range.
Error in <TGLPlotCoordinates::SetRangesCartesian>: Zero axis range.
I do not fully understand this error as the “GLCOLZ” does not give me this error and none of my axis on the histogram are set to 0.
[quote=“kunks112”]I’m quite sure it is not me, since a committee of my peers understands this very well.
I do not see the issue in the concept.
I have 3 variables X, Y, Z. Not 4 (do not know how you got to 4, but I can address that later.)
Now I want to plot X and Y, with the intensity, density, (or however you wish to call it), as the Z variable.
[/quote]
So do you mean, that you DO NOT want TH class to calculate bin content, but just want to use your Z to define the intensity, density (or however you call it) and still have a surface? And X and Y are some arbitrary and not on regular grid?
Do you see this plot
http://root.cern.ch/phpBB3/download/file.php?id=6767&mode=view
I would like the z axis to not be the bin content, I would like the z axis to be a inputted variable, but still look graphically like the image linked.
… duplicated post was deleted
[quote=“kunks112”]Do you see this plot
http://root.cern.ch/phpBB3/download/file.php?id=6767&mode=view
I would like the z axis to not be the bin content, I would like the z axis to be a inputted variable, but still look graphically like the image linked.[/quote]
Do you understand what this plot is? X and Y are on equidistant grid. Z is bin content.
Now your data : arbitrary X, Y and Z, right? So X and Y are not on equidistant grid?
Did you try TGraph2D ?
Hmm, … read what other people told you in this thread, they were trying to explain this to you on two pages: LEGO, SURF - these options are for TH2.
My fifth post on 2nd page
[quote]About the suggestion to use TGraph2D
Heres a quote from root.cern.ch/root/html/TGraph2D.html
This software cannot be guaranteed to work under all circumstances. They were originally written to work with a few hundred points in an XY space with similar X and Y ranges.
This is true, I have over 40k data points, trying to use TGraph2D on 1500 data points ran overnight without results.
[/quote]
[quote]
Hmm, … read what other people told you in this thread, they were trying to explain this to you on two pages: LEGO, SURF - these options are for TH2.[/quote]
My apologies, I meant “GLBOXZ”, and “GLBOX” with those errors, I resolved that issue.
Yes, I also tried TGraph2D with your points (I took only 10000 entires) and right now, it’s still … triangulating ![]() )
)
So, is TGraph2D (if it works) close to what you want?
Ah, ok.
TGraph2D would work, except I was unable to complete the task on 15000 points (sorry for the missing 0 before), in 8 hours. I used a makefile and just tried compiling in ALCiC with no success on my whole data range.
It might be sufficient to use half of the total data, but that is still around 22k points.
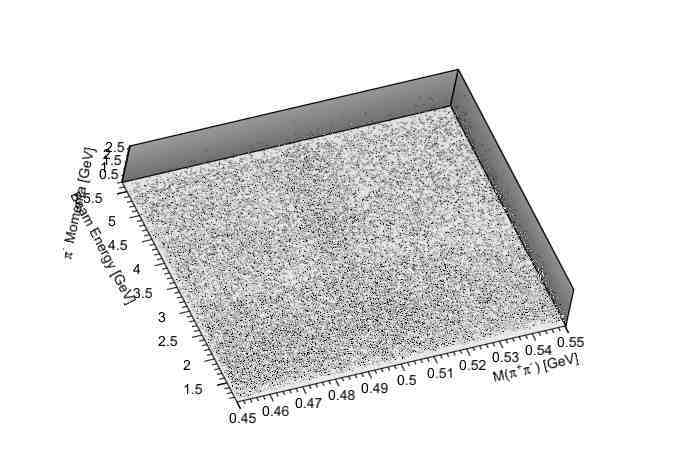
I am uploading a plot below, this plot was generated as a TH3 using the “GLBOX” option.
If I was able to produce this graph with with a color scheme to show population density, this would be exactly what i have been trying to produce.
… duplicated post was deleted
[quote=“kunks112”]TGraph2D would work, except I was unable to complete the task on 15000 points (sorry for the missing 0 before), in 8 hours. I used a makefile and just tried compiling in ALCiC with no success on my whole data range.
It might be sufficient to use half of the total data, but that is still around 22k points.
[/quote]
Unfortunately, there is no difference - ACLiC can not help, since TGraf2D is already a binary code, not interpreted.
[quote]I am uploading a plot below, this plot was generated as a TH3 using the “GLBOX” option.
If I was able to produce this graph with with a color scheme to show population density, this would be exactly what i have been trying to produce.
[/quote]
Well, “GLBOX” draws boxes, with sizes proportional to bin content,in principle, we can add a box color to show bin value also. Actually, glcolz (?) is drawing colored boxes (but all boxes are of the same size).
But I’m afraid, both GL options are useless for you.
What we can try, is to modify box painter to draw colored boxes (or points, we’ll see) not on equidistant grid, but on real x,y,z data with color defined by z.
[quote]Well, “GLBOX” draws boxes, with sizes proportional to bin content,in principle, we can add a box color to show bin value also. Actually, glcolz (?) is drawing colored boxes (but all boxes are of the same size).
[/quote]
I did try glcolz, but it froze my system, therefore I was unable to interpret anything.
[quote]
What we can try, is to modify box painter to draw colored boxes (or points, we’ll see) not on equidistant grid, but on real x,y,z data with color defined by z[/quote]
This would be great and helpful.
How do I begin doing this?
[quote]
This would be great and helpful.
How do I begin doing this?[/quote]
You have several branches. What should be x, y, z?
BTW depending on your data, I’m afraid these boxes will not help - your data looks like a cloud, so we’ll probably see a mess of boxes (but still can try)
Yes, I agree. I do know that the IV_PipPim should show structure at 0.497. I would think if there was a correlation in these 3 variables it wold appear using the Pip_Ptot or Pim_Ptot as the z variable.