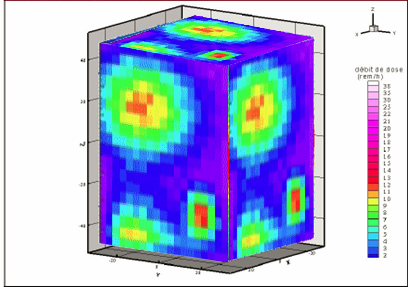
I’d like to draw the content of my voxels à la Tecplot (see tecplot.gif).
Just basic intensity-colored voxels would be fine (see tecplot_rough.png).
I don’t care about the smoothing.
Naively I thought to do something like:
TH3D->SetBinContent(x,y,z,value) ;
TH3D->Draw(“openGL”) ;
And then play with the mouse (+shift key pressed) to go through the slices. http://root.cern.ch/phpBB2/viewtopic.php?t=4965&highlight=th3
I read the “TH3” search results and feel a bit dubious about an easy way to do this.
Could you please show me a way ?
There’s no macro, this is the result from a company software called Tecplot.
Attached is a typical data file (212121 voxels).
Cheers DdD_Co60.txt (651 KB)
[quote]There’s no macro, this is the result from a company software called Tecplot.
Attached is a typical data file (212121 voxels).
Cheers[/quote]
If you have company software for your task, why do you want to use ROOT?
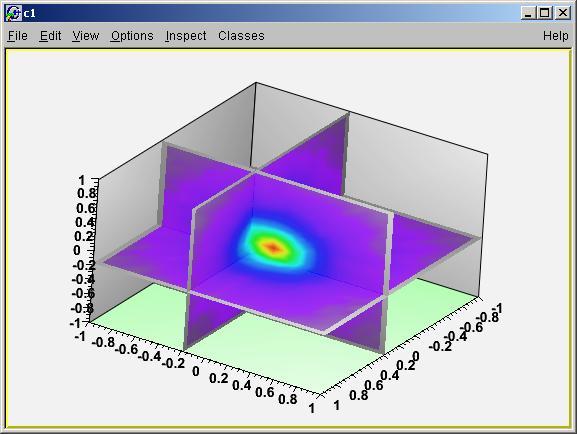
With your data and ROOT’s gl box painter I can get, for example, such picture (see attachment). I’m not sure about the quality (IMHO resolution is low) and correctness (and palette isn’t drawn and different from yours).
[quote]Cause I don’t have it (these are just snapshots) and it’s not free!
It’s very annoying that the palette cannot be displayed.
Aren’t there any tricks?
[/quote]
No, there are some non-obvious problems with win32gdk which I cannot fix and in fact do not have any wish to do it (just open win32gdk source code and you’ll understand, what I mean). In principle, I can do some tricks with OpenGL to draw the palette, but this will require recompilation of your ROOT - can you do this?
[quote]
Could you please send me your current macro ?
Thx[/quote]
That’s not only macro, you need some changes in ROOT’s source code (palette is one reason, the second - see below).
Original idea for slicing in TH3 is a bit different from what you want (I’ve reviewed the code and remembered this) - this slice takes not all volume, it does color profile for some chunk of data (for example, you profile XOZ plane and takes bins number 1 and 2 along Y) - but this can be changed simply. At the beginning, I wanted to do slice thickness manipulation via
some GUI, but later this idea was abandoned.
Actually I use the Cygwin version of Root. So I don’t need to compile anything. I tried it once but it fails so I did not go further…
How about just drawing planes of voxels with commands like
TH3D->SetBinContent(x,y,z,value) ;
TH3D->Draw(0.2,0.5,0.6) ; // with a palette of course
where the 3 arguments refers to the percentage of the mesh
eg for 101010 mesh to the 2nd xOy plane, to the 5th yOz plane and to the 6th zOx plane.
If hard with the TH3D/GL tools, would it possible through the Geometry package ?
I’ve gained some experience with root compilation (on Scientific Linux).
Could you please tell me how to proceed to get the palette drawn ?
How about your idea of slice thickness manipulation via some GUI ?
Can you send the macro you have now so we can have a look at it ?
As far as I know the palette drawing (option Z) has not been implemeted for GL plots.
(Timur correct me if I am wrong).
[quote]Dear tpochep,
I’ve gained some experience with root compilation (on Scientific Linux).
Could you please tell me how to proceed to get the palette drawn ?
How about your idea of slice thickness manipulation via some GUI ?
Thanks in advance,
Z[/quote]
Oh, did you spend all this time compiling ROOT ?
Let’s first define, what you want exactly:
First you wanted to profile 3D array. You have min and max value in this array, and palette will be mapped to this range, the first color ~ min, the last
~max and values and color between them. This differs from glbox slicing, because min and max selected not from all 3D array, but from current slice.
Good or not I do not know.
There are some problems with TVirtualX, DIBS etc. which prevent palette drawing (I’m not going to reverse-engineer win32gdk to fix them).
If I draw palette using GL - I’ll duplicate existing code for palette(possibly, introducing some errors or incompatibilities with existing z option) .
"Let’s first define, what you want exactly"
Ultimately, I’d like to draw plots like those at the beginning of this post (tecplot.gif) with the possibility to play on the interpolation between the content of the voxels :
from raw like in tecplot_rough.png (mid plane of the voxels) or voxels.gif (voxel itself)
to smooth like in tecplot.gif
Your proposition (sample.jpg) is FINE for the time being.
But of course it does not make any sense if there is no colour code associated with the plot.
A palette like those for 2D histograms would be ideal. Min & max values would be fixed by the user. The drawing will be done accordingly.
How about superimposing a dummy pad containing the requested palette ? Or any other palette-like object ?
At worst, I could make two pads, one with the ogl plot, the other with the dummy palette only.
Definitly ? How about slice width with plain command lines (as suggested with voxel.gif) or anything else ?
A GUI interface for this is absolutely not necessary. Still the idea is nice.
[quote]Thanks Timur.
I guess this has been integrated to v5-19-2.
Could you please indicate me how to proceed ?
Cheers, M[/quote]
Hello.
Yes, palette drawing was integrated to v5-19-2. I’m not sure if it’s usefull for you or not - as soon as I draw equidistant filled contours.
BTW I tried colored boxes and colored boxes + transparency - still not sure if they are good for you or not.
Thanks for you quick answer.
That’s really nice! I really like both representations
It would be perfect if the following traditional features were available.
Possibility:
to play with the palette colors (I would prefer the colors you used in your ‘sample.jpg’ (see page 1), gStyle->SetPalette(1))
to play with the palette position, labels…
to add {x,y,z}labels with all the corresponding options…
to work with user-defined {x,y,z}min and {x,y,z}max (instead of -1. and 1.)
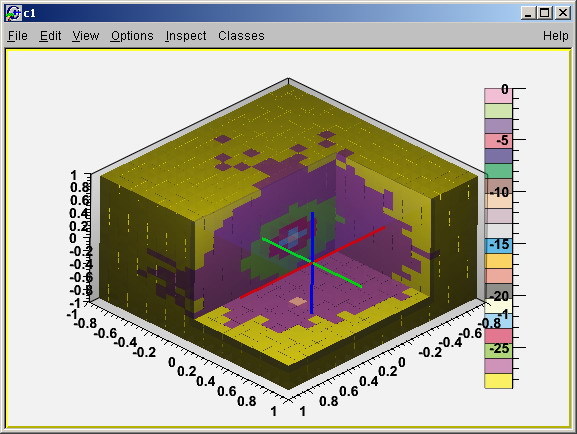
not to display the xyz axes from the origin (green, blue and red lines in ‘opaque.jpg’)
Could you please tell me how to produce such plots ?
Also would it be possible to :
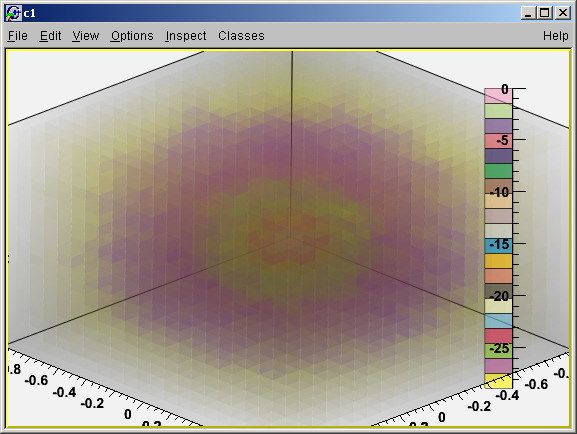
draw a geometrical object inside the plot (like a box, a cylinder, a sphere) in order to superimpose geometry (wireframe) and physical results (transparent voxels as in ‘alpha.jpg’) ?
only draw planes of cubes in ‘opaque.gif’ as in ‘voxels.gif’ (see page 1) which is equivalent to ‘sample.jpg’ (see page 1) with “thick planes”.


 The only problem I have now - how to draw axis near palette correctly.