I was trying to make contour plots similar to what is in the pdf attached. This is where I got stuck, please see the output attached.
name_file="./Dosimetry_Detector_tot.root";
TFile * f = new TFile(name_file,"r");
h3_tot=(TH3D*)f->Get("h3D_Dose_t");
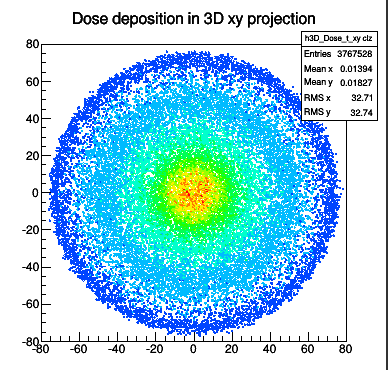
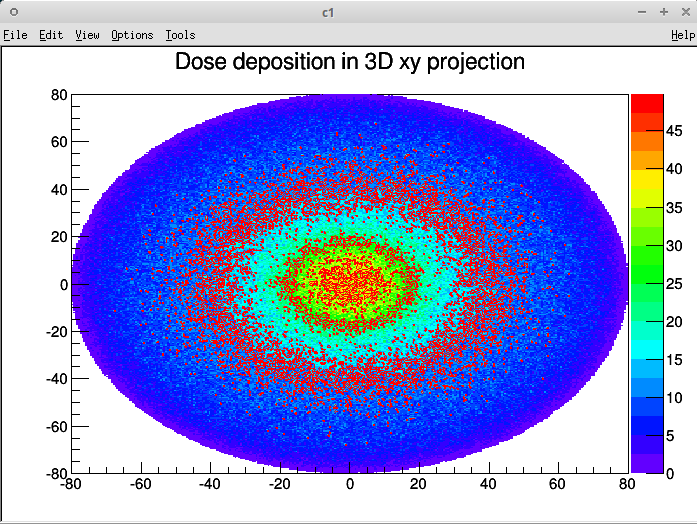
h2_sum_z=(TH2D*)h3_tot->Project3D("xy colz");
h2_sum_z->SetContour(10);
h2_sum_z->DrawClone("Cont1");
This draws an output as the attached picture. This should be 10 equidistant contours, well I don’t know how this compares to percentage. If this matches up with percentages then I would like to draw a line around them and mark with a number as in the pdf.
If not then I need to find a way to define the contours by percentages then draw lines around and numbers.
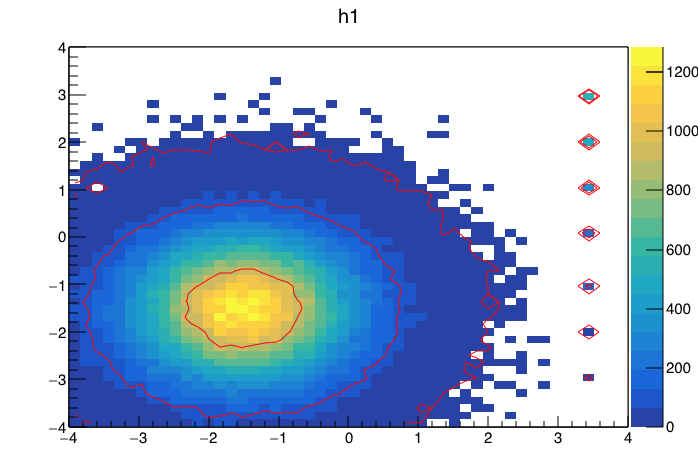
It is because your histogram has many bins varying quickly from one bin to its neighbors.
The color plot looks smooth because the bins are small and, even if the changes have a very high variation frequency, the overall long distance variation in slow. But the contour plot is making its way around all the noise…
May be you can try to smooth the data used to draw the contour or try to have less bins for the contour.