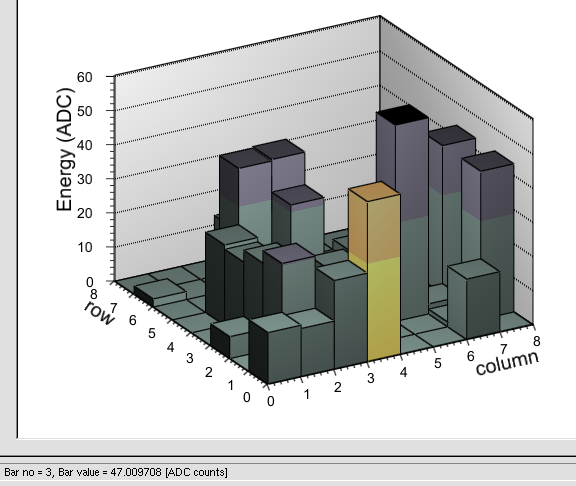
I have a problem with coloring histogram bars according to content.
I am using openGl (gStyle->SetCanvasPreferGL(kTRUE)). I would like to have histogram with 2 colors indicating bars below and above some threshold value.
I tried to do it using stack with 2 histograms (painted with two different colors), but I couldn’t make THStack work with gl functionality (I mean highlighting the bar and displaying bar info: x, y, content).
I can change the color of the bar, but unfortunately color changes only for the part of the bar above threshold (SetPalette and SetContour functions). I would like to have the whole bar painted (from bottom to top) - is that possible?
I am afraid what you are trying to do is not possible with the GL option.
THStack does not work with GL, Draw(“GLSAME”) generates a second picture
in top of the original.
Att a little macro to try the cases.
Without GL it works with e.g. 0LEGO1,
Note: Both histos must have same limits in x y z
The reason I decided to use openGL was the function TGLHistPainter::GetObjectInfo which displays bar information.
I could not obtain correct bin coordinates when mouse clicking on LEGO plot without openGL (what I got was the coordinates from 2D plane). Maybe you know how to get correct coordinates without openGL when clicking on LEGO plot?
Hi,
we should admit that the “Event Status” output is not very useful for LEGO plots
without the GL option.
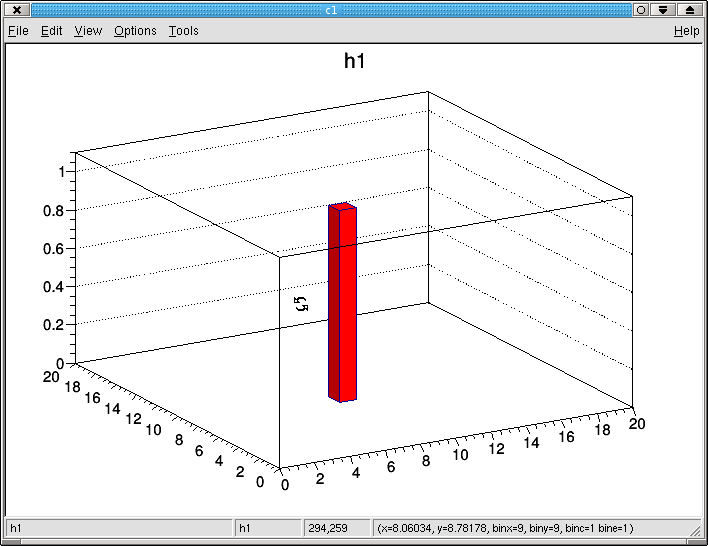
To illustrate this att a little macro and 2 screen copies:
Compare the cursor positions with the x, y binc values.
Note the true value is 9,9 binc 1
Without the GL option one should use “flat” options like COL or BOX
if one needs “pick functionality”