Hi,
I ended up with the following code:
#include <TH2D.h>
#include <TColor.h>
#include <TStyle.h>
#include <TCanvas.h>
using namespace std;
void paleta() {
//palette settings - completely independent
const Int_t NRGBs = 6;
const Int_t NCont = 999;
Double_t stops[NRGBs] = { 0.00, 0.1, 0.34, 0.61, 0.84, 1.00 };
Double_t red[NRGBs] = { 0.99, 0.0, 0.00, 0.87, 1.00, 0.51 };
Double_t green[NRGBs] = { 0.00, 0.0, 0.81, 1.00, 0.20, 0.00 };
Double_t blue[NRGBs] = { 0.99, 0.0, 1.00, 0.12, 0.00, 0.00 };
TColor::CreateGradientColorTable(NRGBs, stops, red, green, blue, NCont);
gStyle->SetNumberContours(NCont);
gStyle->SetOptStat(0);
//here the actually interesting code starts
const Double_t min = 0.9;
const Double_t max = 1.1;
const Int_t nLevels = 999;
Double_t levels[nLevels];
for(int i = 1; i < nLevels; i++) {
levels[i] = min + (max - min) / (nLevels - 1) * (i);
}
levels[0] = 0.01;
// levels[0] = -1; //Interesting, but this also works as I want!
TCanvas * c = new TCanvas();
TH2D *h = new TH2D("h", "", 10, 0, 10, 10, 0, 10);
h->SetContour((sizeof(levels)/sizeof(Double_t)), levels);
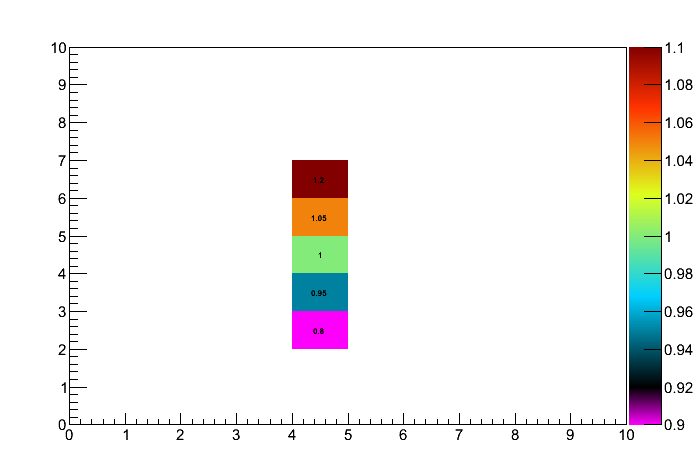
h->SetBinContent(5, 7, 1.20);
h->SetBinContent(5, 6, 1.05);
h->SetBinContent(5, 5, 1.00);
h->SetBinContent(5, 4, 0.95);
h->SetBinContent(5, 3, 0.80);
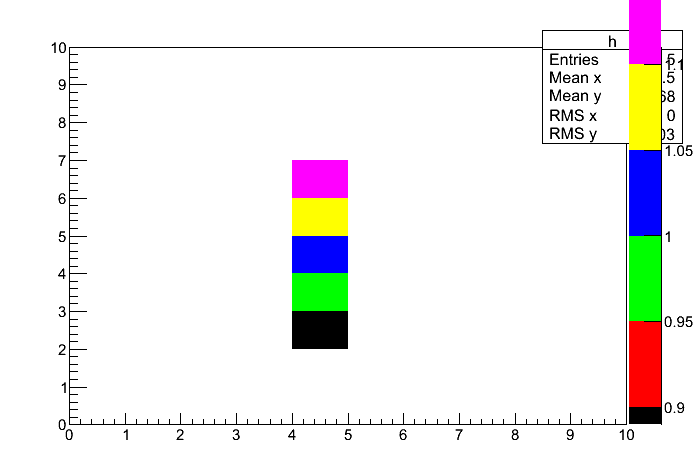
h->DrawClone("col text");// draw "axes", "contents", "statistics box"
h->GetZaxis()->SetRangeUser(min, max); // ... set the range ...
h->Draw("z same"); // draw the "color palette"
c->SaveAs("c.png");
}
Result:
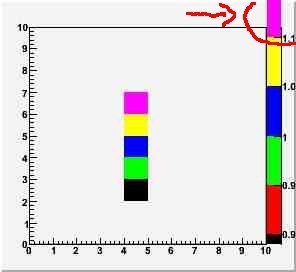
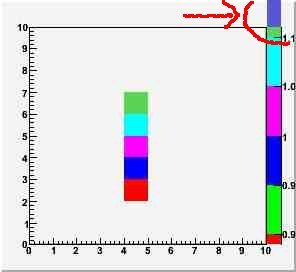
What I found out, that the tricks with -3.4e38 and 1.17e-38 numbers are not really necessary. I can use the standard smooth palette without any modifications, the only trick is setting [color=#00FF00]level[0][/color] to something below [color=#00FF00]min[/color] (and below the minimal value I want to see on the plot). I see no need to use different color for values outside the [min, max] range, it’s usually obvious (at least in my case).
However, the behaviour is quite funny, since the code works nicely when I set [color=#00FF00]level[0][/color] below 0 - the code still works as I want! So ROOT somehow distinguishes between empty (zero) and non-empty bins.