I have a TGraph2D drawn in cont4z option. Then I want to superimpose another TGraph2D
on the same pad to use one of its contours as the exclusion limit for the first plot.
I know how to put them on two pads, making the second pad transparent and so on.
However, The second TGraph2D is a complicated 2D graph. I have limited the number of contours to 2 by doing g->GetHistogram()->SetContour(2) to get the first contour.
This is fine and it works by showing only one contour superimposed on the background graph on the first pad.
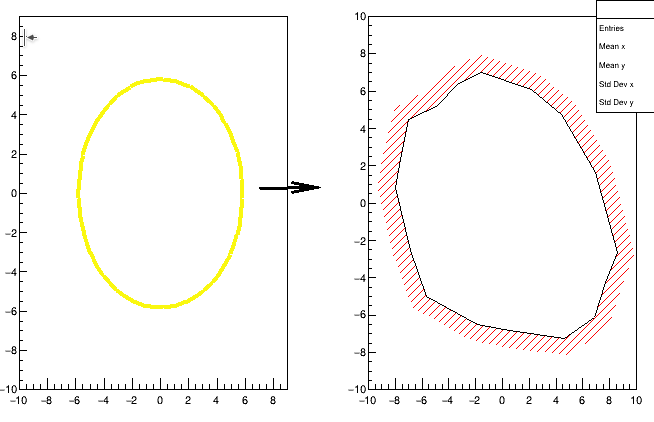
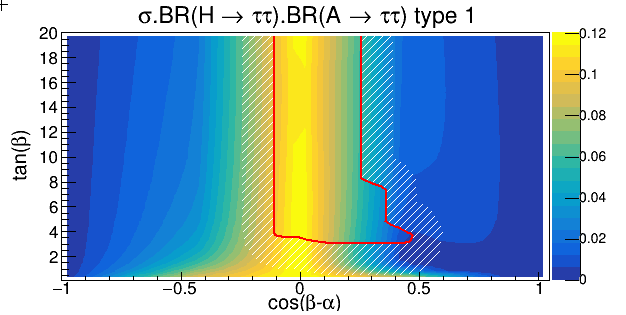
However I want to have hashed style exclusion for the contour so that I show which region of the underlying graph is excluded by the first contour of the second graph on the second transparent pad.
Something like a TCutG but in a more automatic way …
Please give me your comments on how to do it.
I have attached what I want in approximate illustration.
Thanks
Hi,
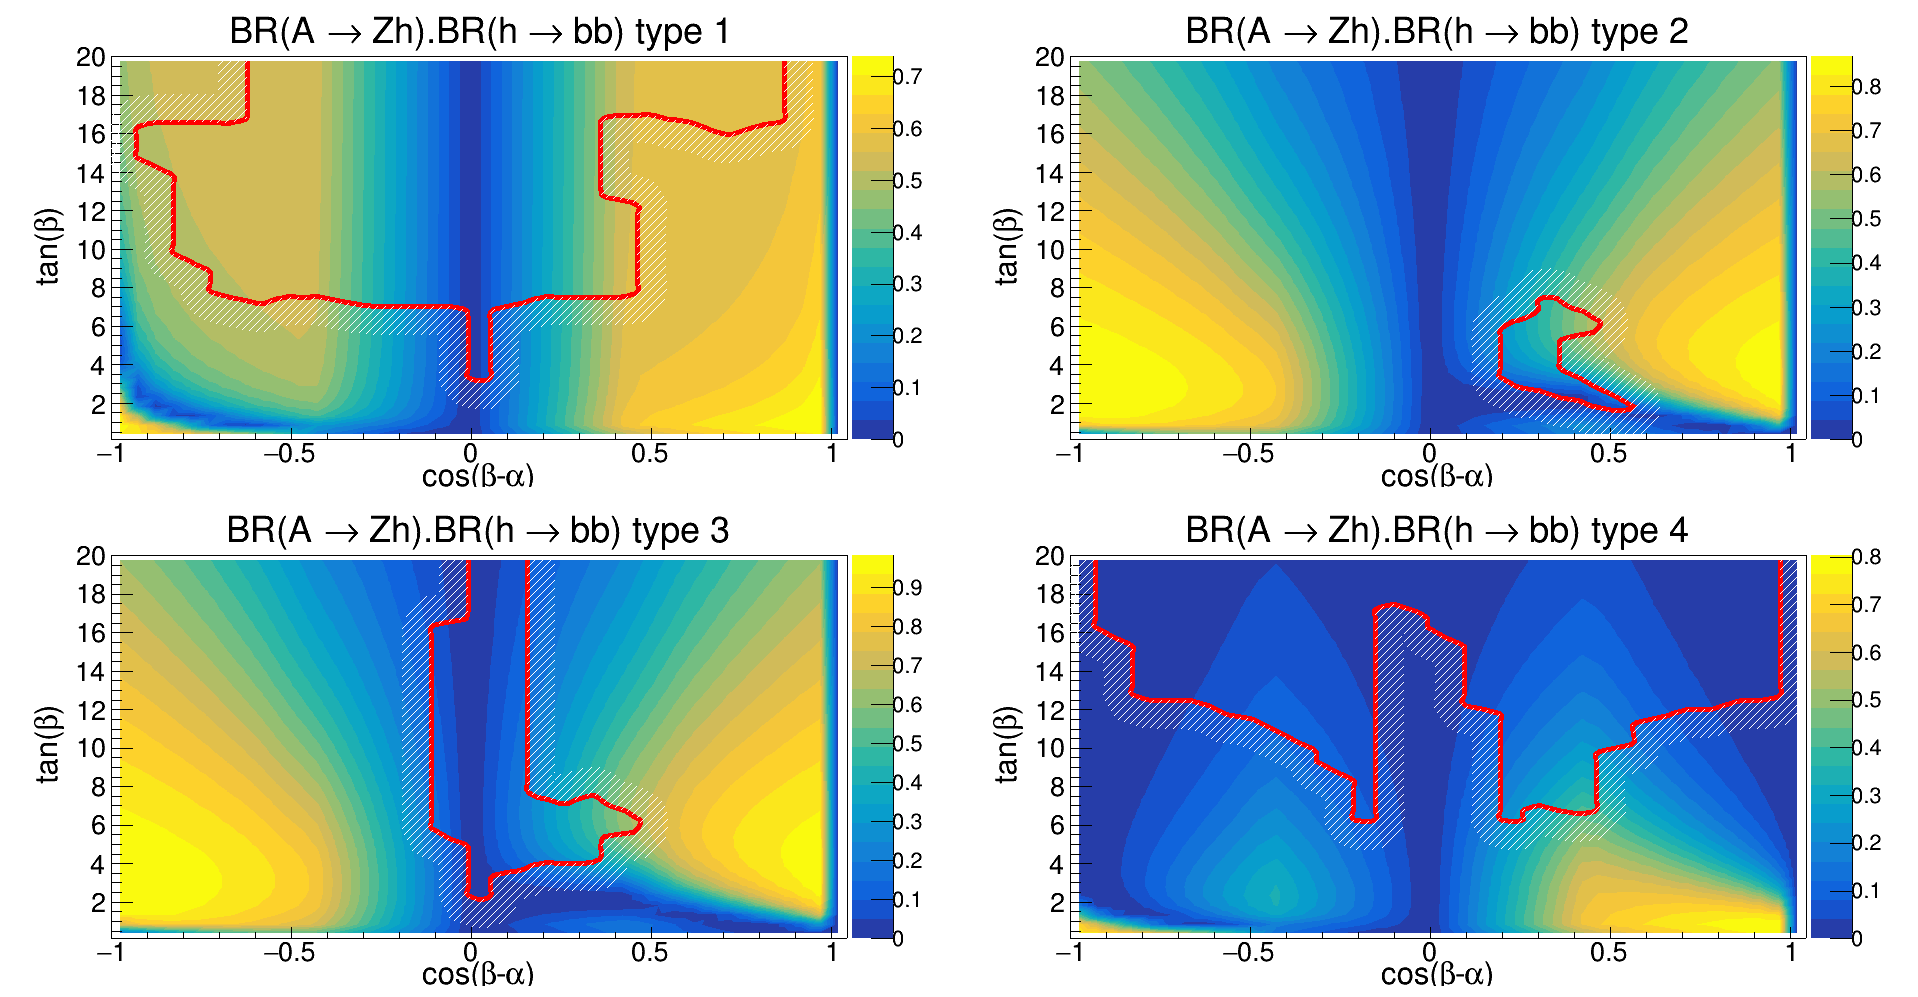
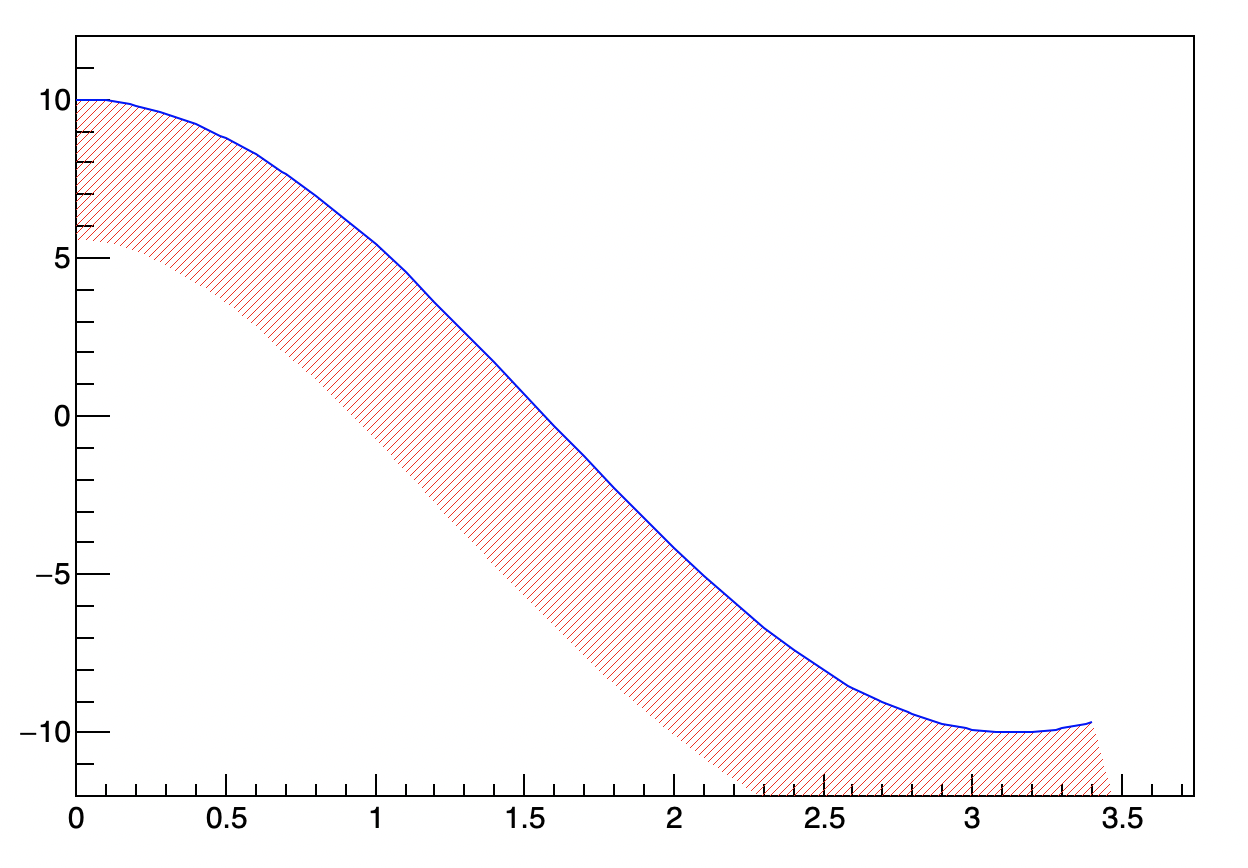
I managed to do it but with some tricks: (pad1 contains the main colorful plot, pad2 contains the exclusion band).
The contour TGraph2D has to be drawn first to fill the contour graphs.
Since I wanted only the graph, I deleted the mother contour plot at the end.
Another point is that gc (exclusion band) shows the hashed exclusion but not the main border line so I cloned it and manipulated the cloned graph to get the red line.
Thanks,
Majid
...
h[type]->Draw("cont list");
 pad2->Update();
  // Get Contours
  TObjArray *conts = (TObjArray*)gROOT->GetListOfSpecials()->FindObject("contours");
  TList* contLevel = NULL;
  TGraph* curv     = NULL;
  TGraph* gc       = NULL;
  TGraph* gcline       = NULL;

  contLevel = (TList*)conts->At(1);

  // Get first graph from list on curves on this level
  curv = (TGraph*)contLevel->First();

  gc = (TGraph*)curv->Clone();
  gcline = (TGraph*)gc->Clone();

  gcline->SetLineColor(kRed);
  gcline->SetLineWidth(5);
  gcline->Draw("C");
  gc->SetFillColor(kWhite);
  gc->SetFillStyle(3004);
  gc->SetLineWidth(300);
  gc->DrawClone("C");
  delete(h[type]);