Simple Fit on Sparse Data, unexpected Result

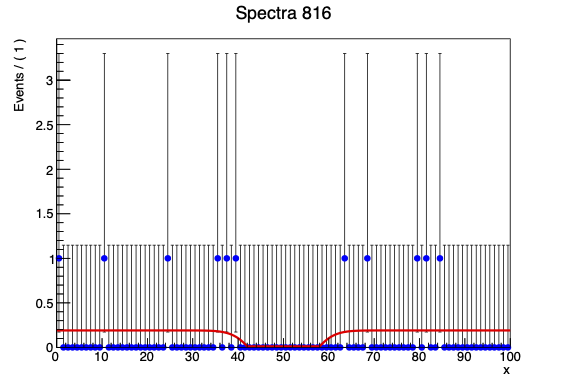
I’m doing a set of toy experiments to produce an expected results. The idea is to generate data according to a very simple uniform distribution, then fit that data with the uniform distribution plus a constrained gaussian (fixed mean, fixed sigma). The result I expect is that the fit will return a signal yield on that gaussian that fluctuates around 0. When I do this experiment for an a mean distribution of 100 or 1000 events, I get that result.

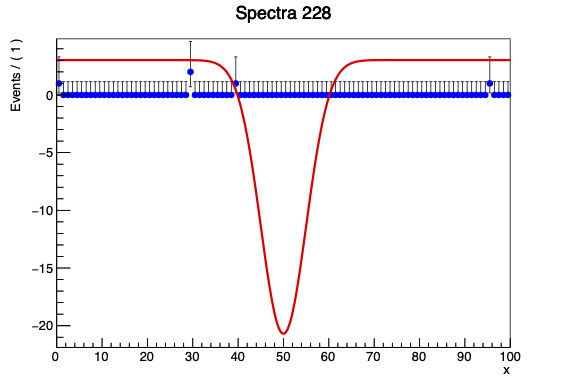
However, when I lower that number to ~10 events I get some inexplicable results from the very sparse datasets. The example.root file I attach here is from one such dataset.

Example.root (5.5 KB)
FitTest.C (1.4 KB)

Example

as far as I can tell it’s either:

  1. the possible negative yield on the gaussian breaks the positive definiteness roofit needs to fit. I wouldn’t mind constraining the fit to be positive over the range, but I’m not sure how to exactly to impose that constraint. My understanding was that Roofit should do this naturally by returning prohibitive values when the function was negative.
  2. I just don’t understand the structure of RooAddPdf and am breaking rules by using that when allowing negative coefficients. In the documentation I see some alternative structures to use: RooRealSumFunc / RooRealSumPdf, but subbing either of those in doesn’t seem to make the resulting fit make sense. My understanding of the distinction is that both the components (the polynomial and gaussian) are normalizable and non-negative so RooAddPdf should be the right structure.

Any guidance would be welcome.

I guess @jonas can help you.

Hi @usccaa,

indeed, you are using the RooAddPdf in a way that is not intended. The yield parameters need to be strictly positive, otherwise this is considered unphysical because there are no negative numbers of signal or background events. In other words, the coefficients of all component pdfs need to be positive definite.

If you really want to allow “negative yields”, I would suggest you re-parametrize your problem with a RooGenericPdf in such a way that you have a total pdf that can’t be negative, and then wrap it in a RooExtendPdf to get the extended term:

   RooFormulaVar sigNorm("sigNorm", "1./(x[0]*sqrt(2*TMath::Pi()))", {sig}); // normalization term for the Gaussian
   RooFormulaVar bkgNorm("bkgNorm", "1./100.", {}); // xmax - xmin in the denuminator, no params
   RooFormulaVar totalYield("totalYield", "x[0] + x[1]", {sigy, bkgy});
   RooFormulaVar coef("coef", "x[0] / abs(x[0] + x[1])", {sigy, bkgy});

   RooGenericPdf modelNonExtended("modelNonExtended",
      "x[5] * (1 - x[3]) + x[4] * x[3] * exp(-0.5*(x[0]-x[1])*(x[0]- x[1])/(x[2]*x[2]))",
      {En, mean, sig, coef, sigNorm, bkgNorm});
   RooExtendPdf model{"model", "model", modelNonExtended, totalYield};

All these RooFormulaVar are transforming your original parameters in such a way that you can formulate a model equivalent to your original RooAddPdf, but in such a way that it can’t become negative.

Note that this model still assumes that the total yield is positive, but that should be no problem if you have no negative weights in your data :slight_smile:

The only drawback of this approach is that the normalization integral will be figured out by RooFit numerically, which has some performance penalty. If you can’t afford that, you need to implement your custom class inheriting from RooAbsPdf, which also overrides the relevant functions for analytical integration (e.g. analyticalIntegral() and getAnalyticalIntegral()). But I assume this is no problem in a 1D fit.

Long story short: please re-consider if you really want to allow negative yield parameters, and if you want to do that there is a solution at the cost of some performance.

I hope this helps!

Cheers,
Jonas

I understand at a base level what you’re saying about RooAddPdf: all parts must be positive. Performance penalties are acceptable, so I’ve implemented your solution.

FitTest_1.C (1.9 KB)
Example1.root (5.5 KB)

Example1

it seems like I’m encountering something akin to the same issue, except now the fitter isn’t fitting Total Yield to the number of background counts, it’s fitting background yield and railing to the signal yield to the lowest number??

Thanks for sharing this method. TBH, it looks a bit complicated, so I guess I need to play around with it to ensure I fully understand how it works. I had the same diagram, and to fix it, I had to use third-party apps, which is definitely not my cup of tea.

This topic was automatically closed 14 days after the last reply. New replies are no longer allowed.