I’m trying to make the Y axis of the ratio part of my TRatioPlot less cluttered by setting NDivisions, but I can’t work out how to do it.
Here’s my attempt (from ChatGPT!):
    hRatioPlot->GetLowerRefGraph()->GetYaxis()->SetNdivisions(1, kFALSE); // Set the number of divisions for major ticks
    hRatioPlot->GetLowerPad()->cd();
    hRatioPlot->GetLowerRefGraph()->Draw("AP");
I’ve tried varying the number I give to SetNDivisions but this is the lowest I can get it and it’s still too overcrowded
Result:
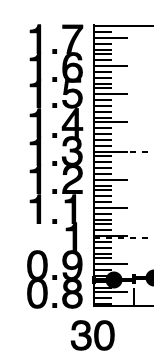
First without:
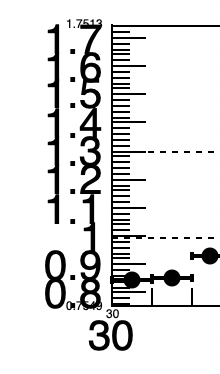
Then with the SetNDivisions:
The second labels seem to come when I redraw the LowerRefGraph in the third line of the snippet above.
Here’s a minimal macro that reproduces the effect:
void Temp(){

  TFile* fData = TFile::Open("~/Downloads/Run654_AnalysisOutputFile.root");
  TFile* fMC   = TFile::Open("~/Downloads/MC_NoTarget28k_Temp_AnalysisOutputFile.root");

  TH1D* hDataTempUnZoom =  (TH1D*)fData->Get("PVetoClusters/hChPVetoCluster");
  TH1D* hMCTempUnZoom   =  (TH1D*)fMC->Get("PVetoClusters/hChPVetoCluster");

  TH1D* hData = new TH1D("ZoomPVetoClusterOccupancy","ZoomPVetoClusterOccupancy",41,30,71);
  TH1D* hMC = new TH1D("ZoomPVetoClusterOccupancyMC","ZoomPVetoClusterOccupancyMC",41,30,71);
  for(int ii=30;ii<71;ii++)
    {
      hData->SetBinContent(ii-29,hDataTempUnZoom->GetBinContent(ii+1));
      hMC->SetBinContent(ii-29,hMCTempUnZoom->GetBinContent(ii+1));
    }

  Double_t scalef = hData->GetSum()/hMC->GetSum();
  hMC->Scale(scalef);

  TCanvas* cRatioPlot = new TCanvas("cRatioPlot","cRatioPlot",900,700);
  TRatioPlot* hRatioPlot;

  hRatioPlot = new TRatioPlot(hData,hMC);
  hRatioPlot->SetH1DrawOpt("E");
  hRatioPlot->SetH2DrawOpt("HIST");

  hRatioPlot->Draw();
  hRatioPlot->GetLowerRefGraph()->SetLineWidth(2);
  hRatioPlot->GetLowerRefGraph()->SetMarkerStyle(8);
  hRatioPlot->GetLowerRefGraph()->GetYaxis()->SetNdivisions(2, kFALSE); // Set the number of divisions for major ticks
  //hRatioPlot->GetLowerRefGraph()->GetYaxis()->SetNdivisions(10, kTRUE); // Set the number of divisions for minor ticks
  hRatioPlot->GetLowerPad()->cd();
  //hRatioPlot->GetLowerRefGraph()->Draw("AP");
}
Commenting the last line gives just one set of (overcrowded) labels. Adding the last line as well produces the secondary labels
I realise this, but obviously the spacing will depend on the values of the plots which give the ratio.
I was hoping it was something obvious in the code that gave this behaviour, but if not then I understand if you can’t help me