I was trying to draw a scatter plot (2D Graph) with a color bar (the z-axis) with the draw option g_temp->Draw("x:y:z","colz"); following the earlier post https://root-forum.cern.ch/t/scatter-contour-plots/18755?u=saumyenk
However, it says “too many arguments” to the “Draw” function as in below:
/Scatter.C:13:24: error: too many arguments to function call, expected at most single argument 'option',
      have 2 arguments
  g_temp->Draw("x:y:z","colz");
  ~~~~~~~~~~~~         ^~~~~~
/usr/local/etc/../include/TGraph2D.h:95:4: note: 'Draw' declared here
   virtual void          Draw(Option_t *option="P0");
Only the "colz" working fine, but I want a scatter plot instead.
I have attached the example macro and a data file. Could kindly guide me what option should I give? data.txt (63.5 KB) Scatter.C (353 Bytes)
That’s for drawing trees or ntuples, not for graphs (or TGraph2D in your case). Anyway, I don’t think TGraph2D is appropriate for what you want; just use a TH2 (e.g. TH2D) and draw it with “colz” https://root.cern/doc/master/classTHistPainter.html#HP14
Thanks a lot, @dastudillo and @ferhue .
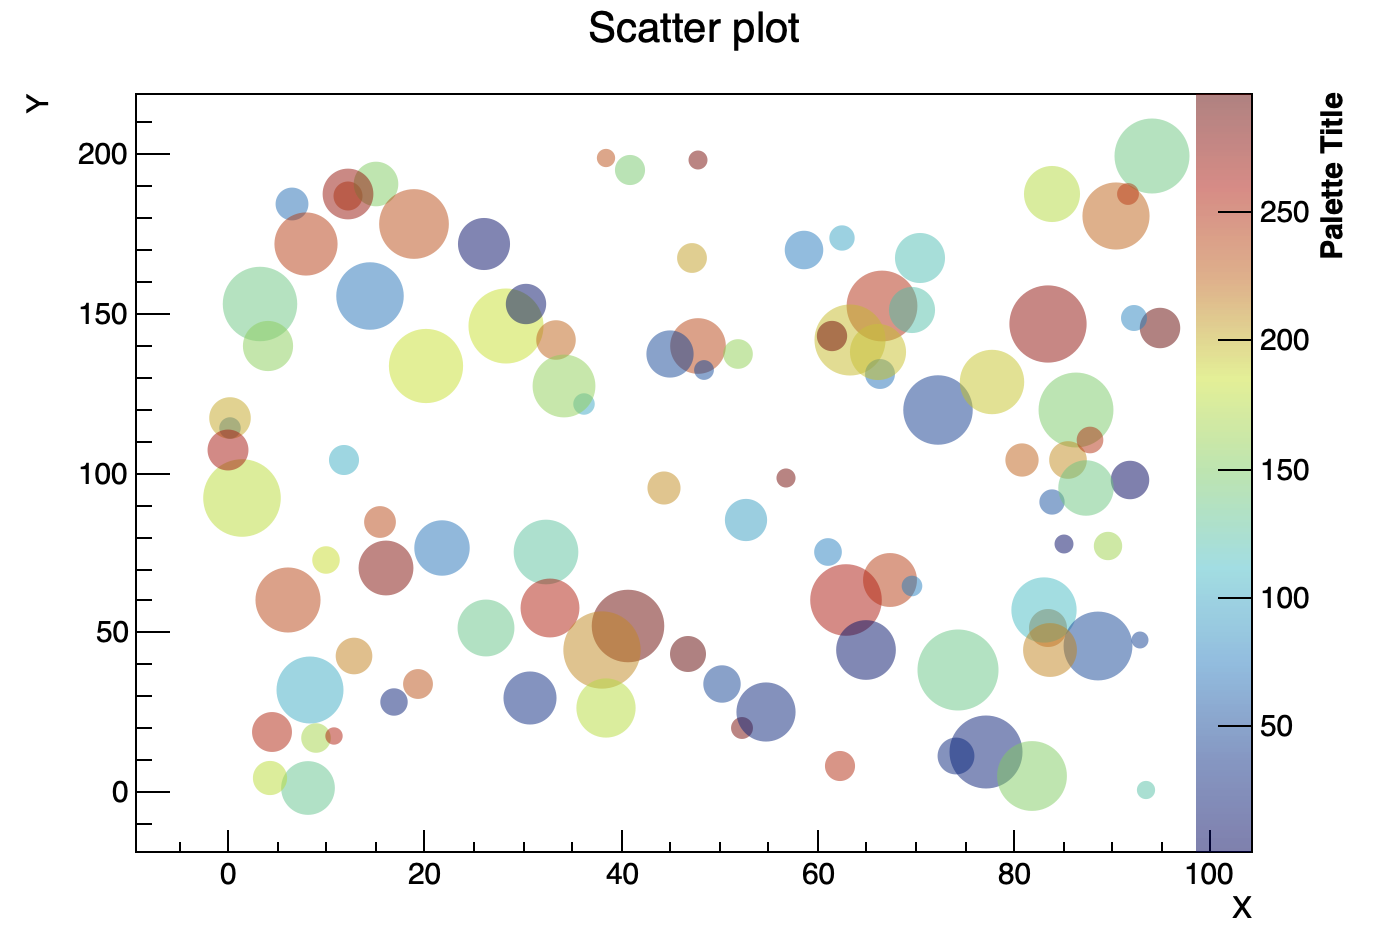
It seemed easier with the TScatter class. However, in another machine with root 6.24/08 I tried. It doesn’t have the class. Could you tell me from which version the TScatter class is available?
If I install two ROOT – 1. with snap and 2. by building from source; will they create a conflict anyhow? For other ROOT-dependent packages (e.g. Delphes) which root they will consider?
And how do you think is the best way to install ROOT – in a specified installation directory or in the /usr/local.
Maybe a developer can give better advice, but I’d say it’s ok as long as you keep the installs in different folders; remember that before using any ROOT you have to source the file /path/to/that/root/bin/thisroot.sh (for bash shells), so that will define which ROOT is used at any time.
I think it is better to download the binary release, rather than building from source.
Download different versions, and unzip them under /opt/root632 and /opt/root630 to easily switch between them. And uninstall the snap version (in my opinion).
Thanks a lot guys, @dastudillo@couet@ferhue . I will try to build locally in a specific directories and source everytime. Binary dists, I don’t know if that’ll be suitable for me as I have a some modified library files.
But in the meantime I’m facing a issue putting a axis title for the colorbar. I tried with the attached macro. But the Z-axis title won’t appear. I saw to access the axes one has to call the GetHistogram() function. But still… Although, the function I’m using is not returning any error. Also the limits of the Z-axis cannot be changed. Is it anyway possible?