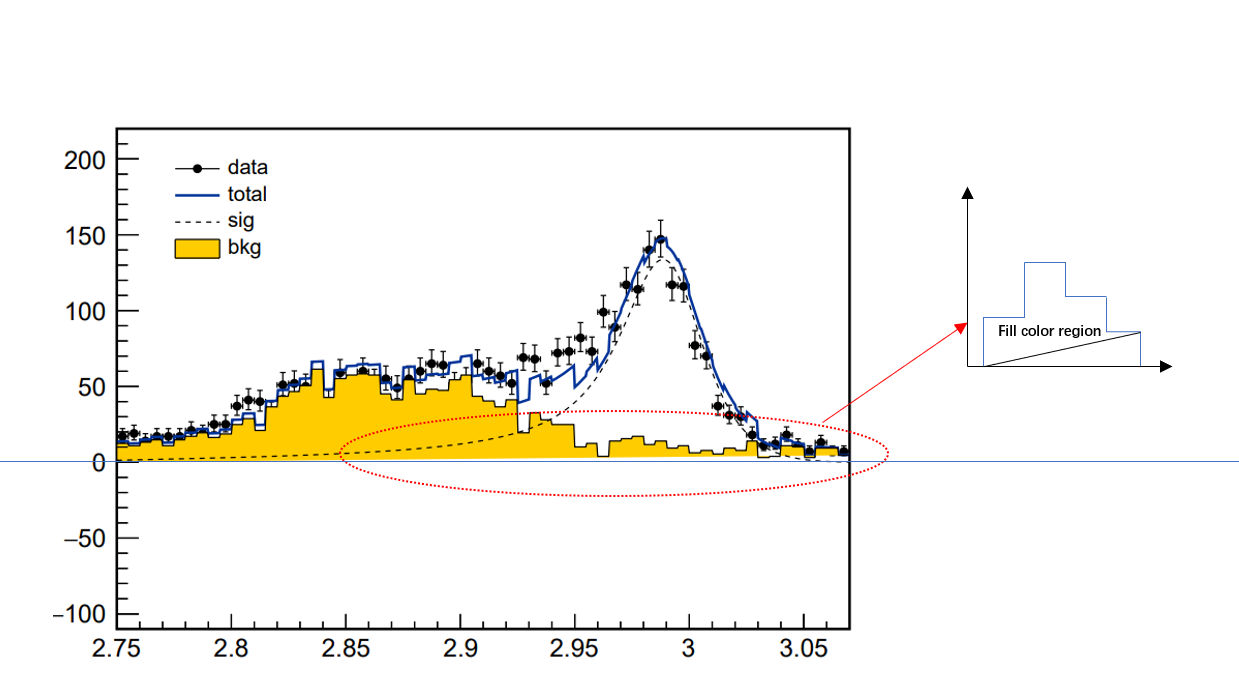
When I use “FL” option to draw RooHistPdf, I find only the region between the “histogram curve” and the start-end line is filled. Is there any way to solve that?
As the figure shows, you can find there is a white region on the right side of the histogram (up to zero axis,triangle shape, marked by the dashed red circle)
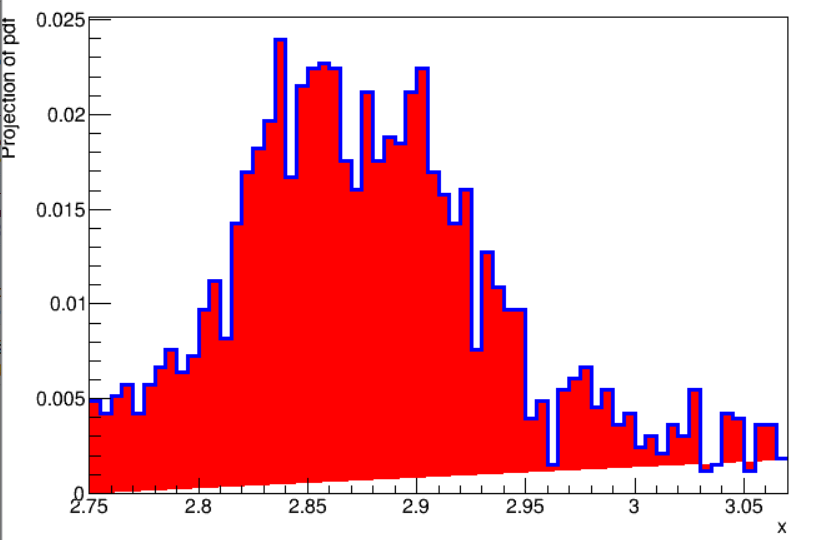
Ah yes, I see a very flat triangle. I am not sure how Rootplot renders this “histogram” is it a real histogram or a graph … @moneta should know. Can you send the canvas (as a root file) so I can inspect how this is drawn ?