Dear RooFit experts,
I am having trouble fitting a subrange of my data using model.fitTo(data,Range(“rangename”)). The result of the fit is always the same, but the drawn curve depends on the full range of the variable. I have attached a modified rf203_ranges.C tutorial to demonstrate this.
In the example, I generate data using a RooExponential PDF over the range -10 to 10. Then I try to fit it with an order 2 RooBernstein PDF over the range -3 to 3. The result of the fit is attached as fitfull.png. As you can see, it is not a very good fit. Also the Bernstein coefficients are found to be:
a0 = 1, a1 = 0.550672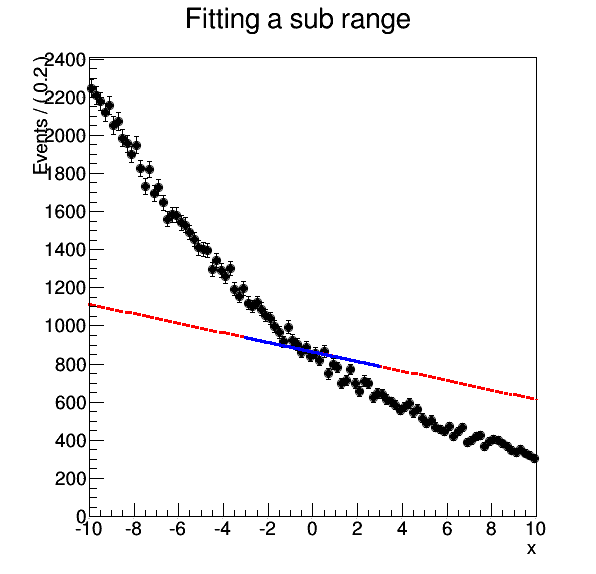
On the other hand if I restrict the x variable to the range -3 to 3 to begin with, I get a much better fit. The result is shown in fitsignal.png. Also the Bernstein coefficients are found to be:
a0 = 1, a1 = 0.547555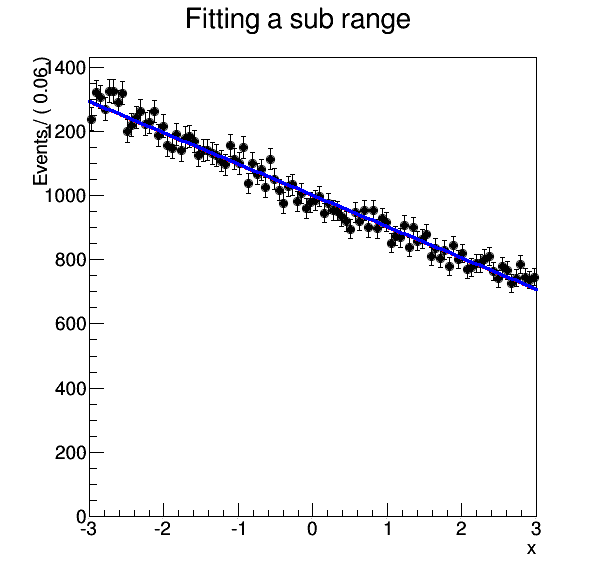
Why is there this difference? The fit part seems to be working ok, since the coefficients of the Bernstein polynomials are the same in both cases. However the draw part shows two different curves. I thought drawing a PDF only fitted the normalization, not changed its shape.
rf203_ranges.C (2.5 KB)