Hi,
I’m producing these plots using PyROOT and RooFit (6.34.02).
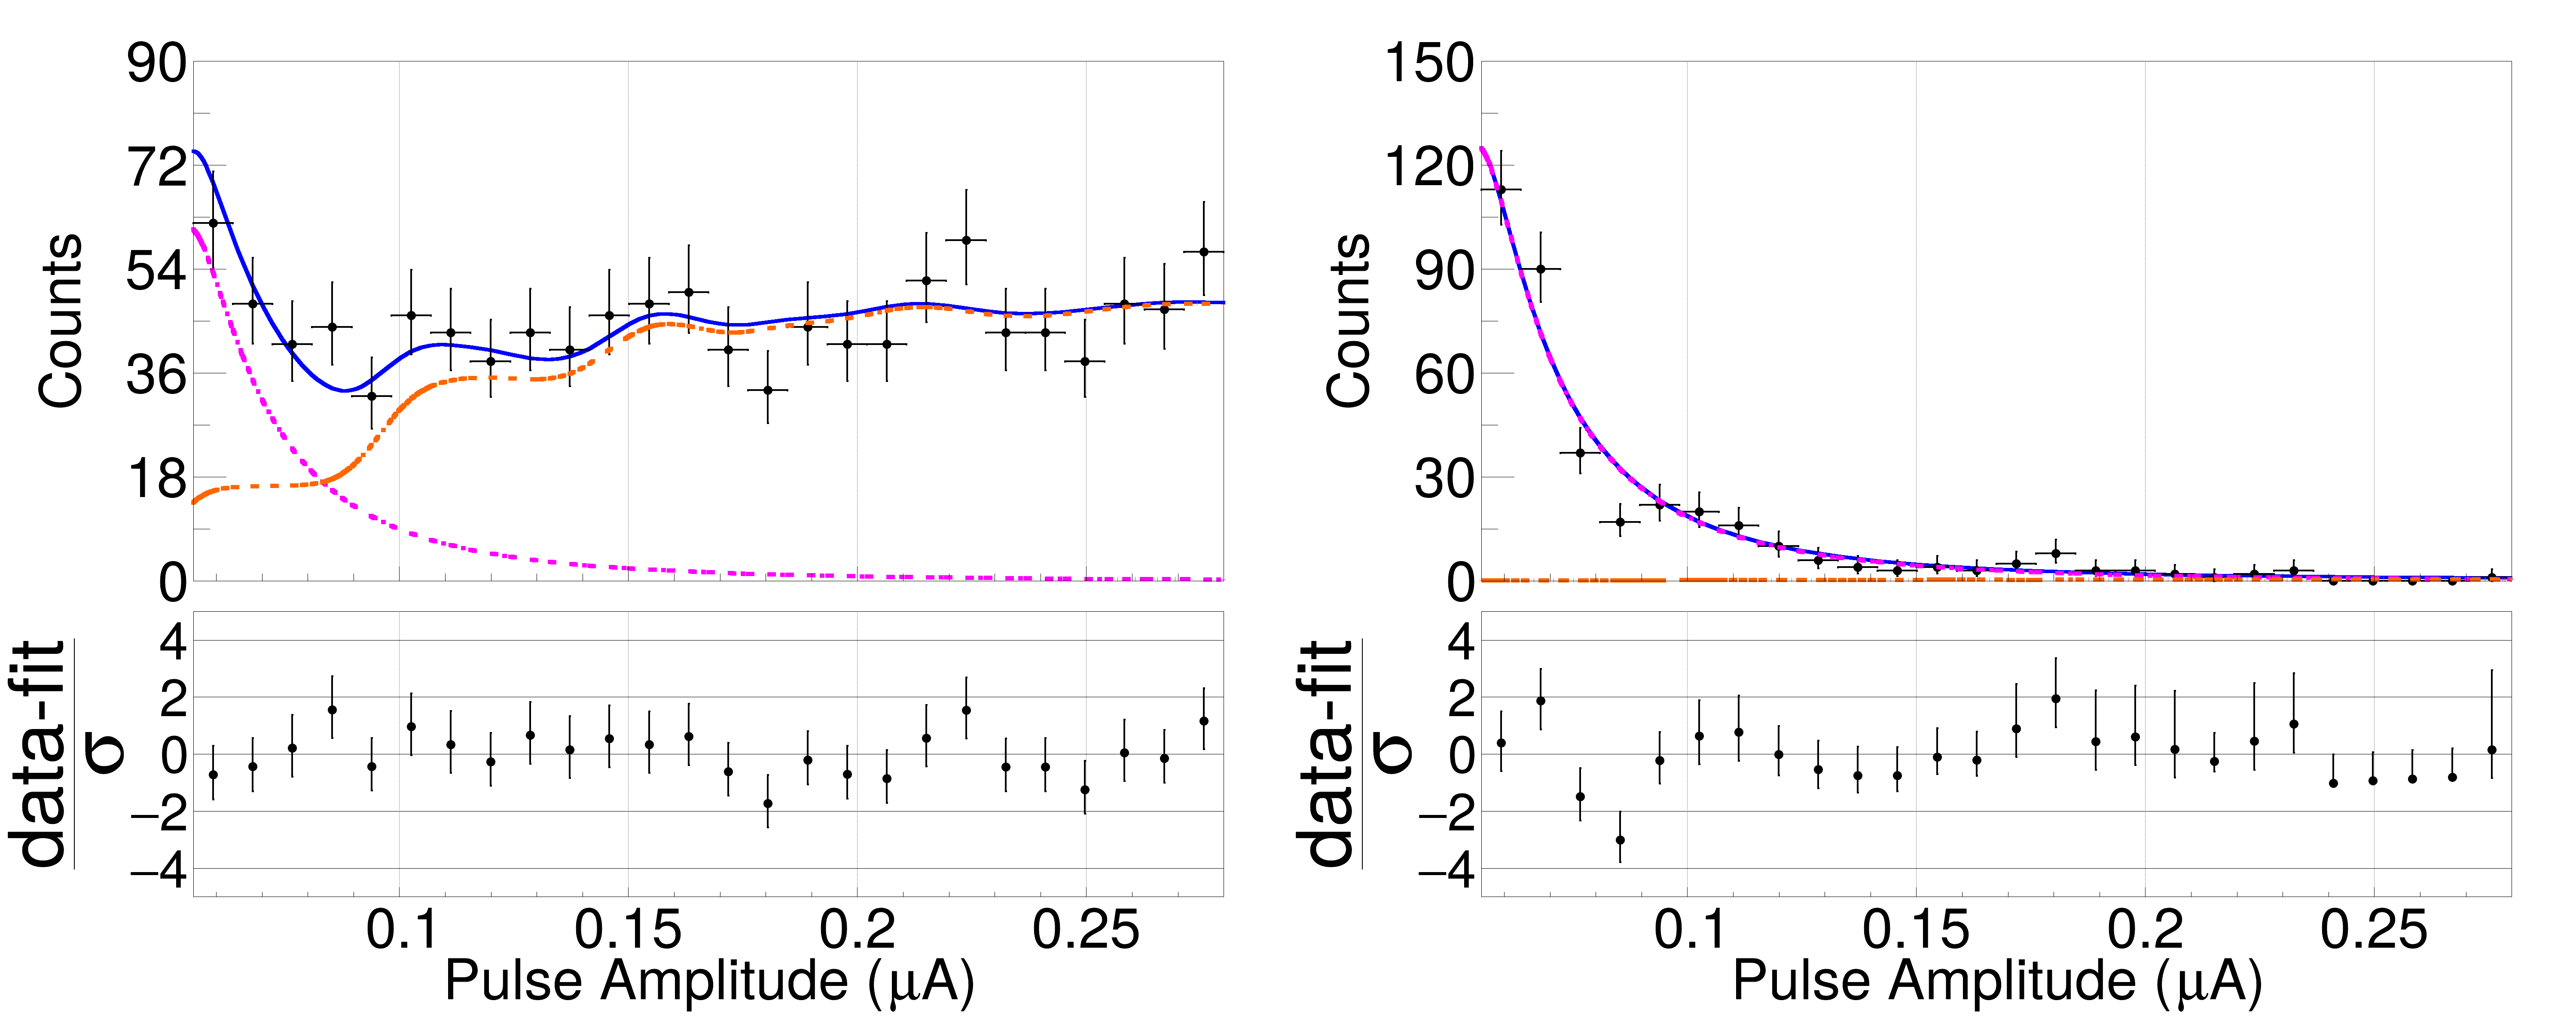
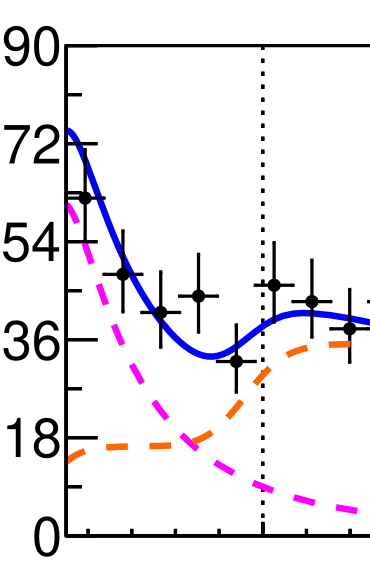
The dashed lines are rendered poorly, and I couldn’t identify the issue. I wonder if this is a known issue and whether there’s a fix for it?
I’m sharing relevant snippet of my code:
**skipped a loop here**
frames[det,source]=w[f'ofl_{det}'].frame(Title=f" ",Bins=nbins,)

**skipped some code here**
w[f'pdf_{det}_{source}'].plotOn(frames[det,source],Components=f'exponential_{det}_eff',
                                LineWidth=10,
                                LineStyle = 10,
                                LineColor= 6,
                                NumCPU=1,
                                MoveToBack=False)
c = ROOT.TCanvas(det, det, 6000, 2400)
c.Draw()
pad1,pad2 = createHorizontalPads(c)
for pad, source in zip([pad1,pad2],['sig','bg']):
     inner_pads = createVerticalPads(pad,frames[det,source],pull_frames[det,source])

     frames[det,source].GetYaxis().SetTitleSize(0.1)
     frames[det,source].GetYaxis().SetLabelSize(0.1)
     frames[det,source].GetYaxis().SetTitleOffset(0.65)
     frames[det,source].GetYaxis().SetNdivisions(-205)
     frames[det,source].GetXaxis().SetLabelOffset(999);
     frames[det,source].GetXaxis().SetTitleOffset(999);
     frames[det,source].GetXaxis().SetNdivisions(508)
     frames[det,source].GetYaxis().SetTitle('Counts')#
     frames[det,source].GetXaxis().CenterTitle(True)
     frames[det,source].GetYaxis().CenterTitle(True)

     for pad_count, pad in enumerate(inner_pads):
          pt = pad.GetPrimitive('title');
          pt.SetTextSize(0.1);
          pt.SetX1NDC(0.48)
          pt.SetX2NDC(0.55)
          pt.SetY1NDC(0.94)
          pt.SetY2NDC(0.98)

          pad.cd()
          pad.Draw()

c.Draw()
C.SaveAs('---.png')
def createHorizontalPads(mother):
    mother.cd()
    # Upper histogram plot is pad1
    pad1 = ROOT.TPad('1', '1', 0, 0, 0.5, 1.0)
    set_margin(pad1, 0.00,0.0,0.0,0.)
    pad1.Draw()
    # Lower ratio plot is pad2
    mother.cd()  # returns to main canvas before defining pad2
    pad2 = ROOT.TPad('2','2', 0.5, 0., 1, 1)
    set_margin(pad2, 0.0,0.0,0.0,0.0)
    pad2.Draw()
    return pad1, pad2

def set_margin(mother, top,bottom,right,left):
    mother.SetTopMargin(top)  # joins upper and lower plot
    mother.SetBottomMargin(bottom)
    mother.SetRightMargin(right)
    mother.SetLeftMargin(left)

def createVerticalPads(mother,f1,f2):
    mother.cd()
    # Upper histogram plot is pad1
    pad1 = ROOT.TPad('1', '1', 0, 0.4, 1, 1.0)
    set_margin(pad1, 0.1,0.05,0.05,0.15)
    pad1.SetGridx()
    pad1.Draw()
    pad1.cd()
    f1.Draw()
    pad1.Draw()
    # Lower ratio plot is pad2
    mother.cd()  # returns to main canvas before defining pad2
    pad2 = ROOT.TPad('2','2', 0, 0.0, 1, 0.4)
    set_margin(pad2, 0.0,0.3,0.05,0.15)
    pad2.SetGridx()
    pad2.Draw()
    pad2.cd()
    f2.Draw()
    pad2.Draw()
    for sig in (-4,-2,0,2,4):
        line = get_axhline(pad2,sig)
        line.SetLineWidth(1)
        line.SetLineStyle(1)
        line.SetLineColor(ROOT.kBlack)
        line.DrawClone()
    return pad1, pad2
Thank you for any hint.