Thanks!
#include<stdio.h>
#include<iostream>
#include<stdlib.h>
#include<math.h>
#include "TFile.h"
#include "TH1F.h"
#include "TPaveStats.h"
#include "TCanvas.h"
#include "TMultiGraph.h"
#include "TGraph.h"
#include "TAxis.h"
void HV_comp_red(){
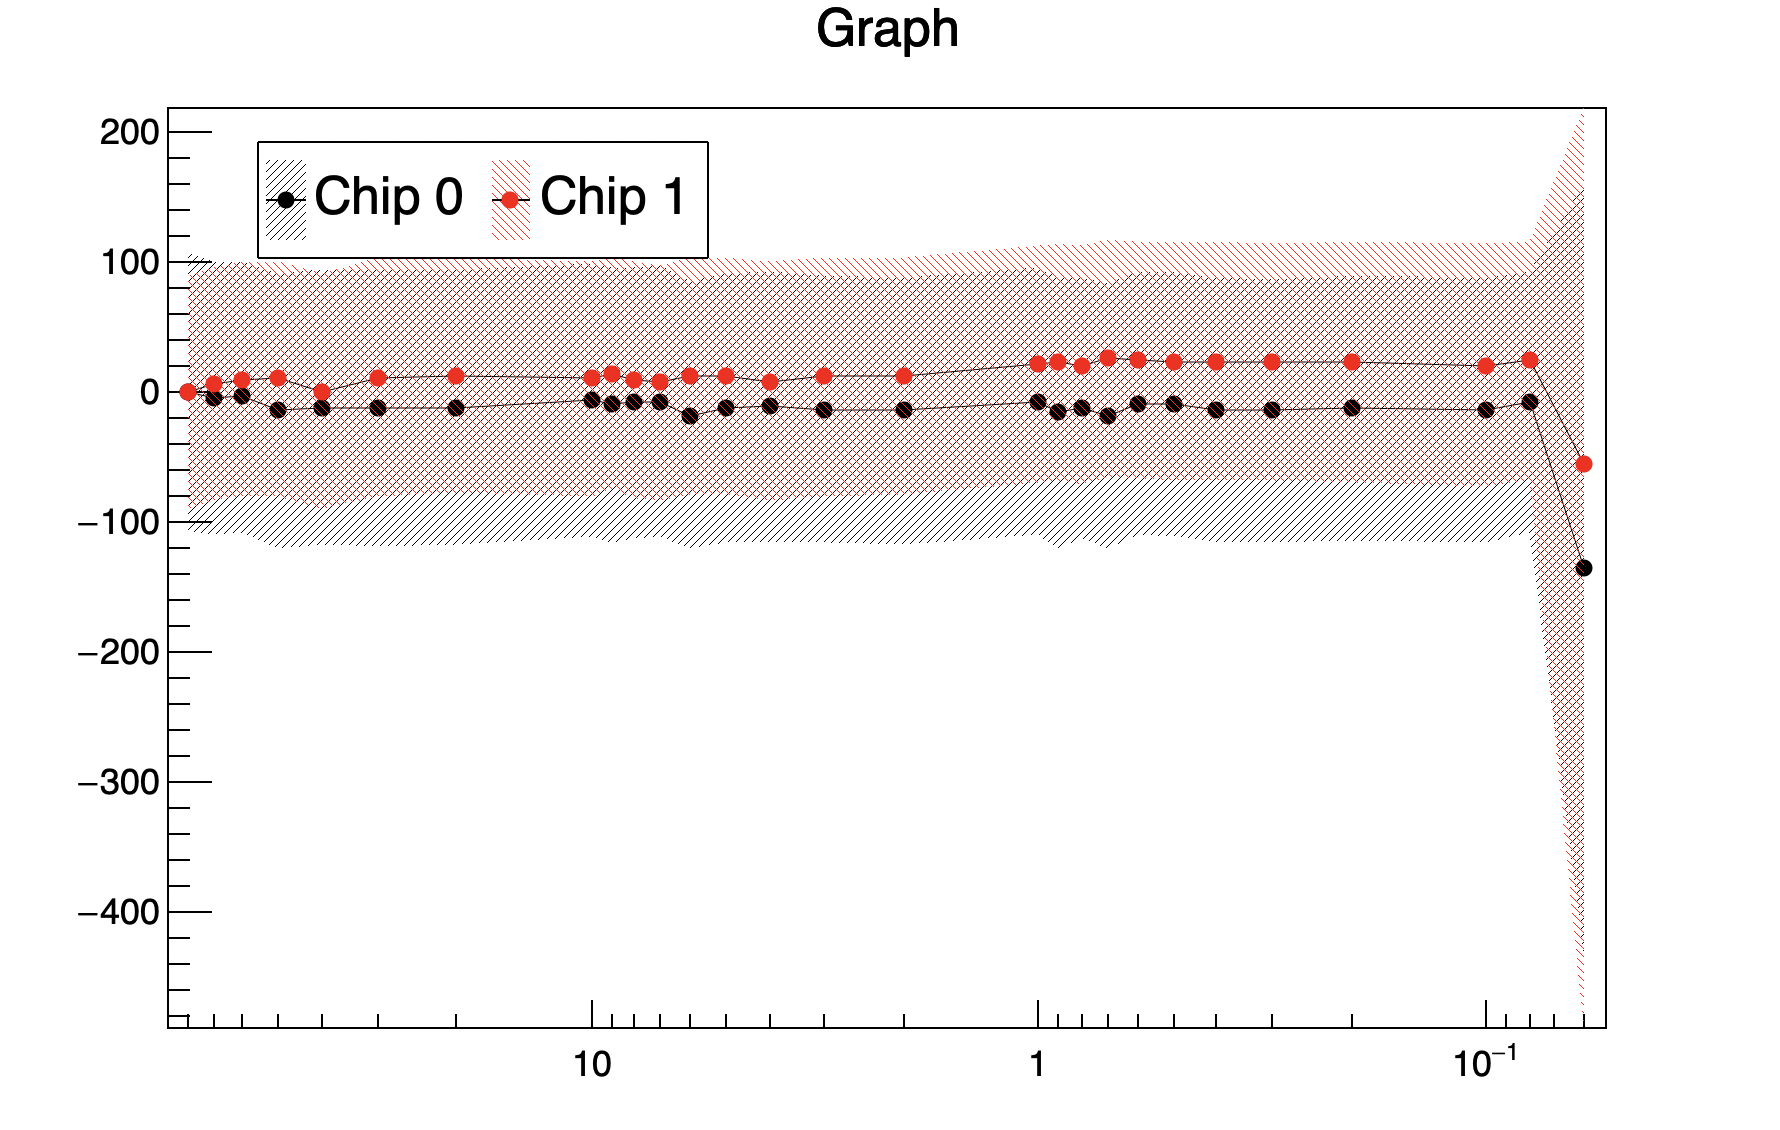
Double_t biasVoltage[28] = {80., 70., 60., 50., 40., 30., 20., 10., 9., 8., 7., 6., 5., 4., 3., 2., 1., 0.9, 0.8, 0.7, 0.6, 0.5, 0.4, 0.3, 0.2, 0.1, 0.08, 0.06};
Double_t errors_voltage[28] = {0., 0., 0., 0., 0., 0. , 0., 0., 0., 0., 0., 0., 0., 0., 0., 0., 0., 0., 0., 0., 0., 0., 0., 0., 0., 0., 0., 0.};
Double_t mean0[28] = {0., -4.45, -3.81, -14.65, -11.81, -12.56, -12.25, -6.26, -9.40, -7.98, -7.14, -17.87, -12.26, -11.41, -13.35, -14.51, -7.51, -16.15, -12.67, -18.58, -8.76, -8.94, -13.75, -14.31, -12.76, -14.16, -8.24, -135.4};
Double_t std0[28] = {105.8, 104.9, 104.1, 105.8, 104.9, 105.6, 105.3, 104.9, 105.3, 103.8, 104.0, 102.3, 102.9, 103.4, 102.5, 102.6, 102.1, 103.6, 100.3, 101.1, 101.1, 101.5, 101.8, 100.7, 101.1, 101.4, 100.0, 294.7};
Double_t mean1[28] = {0, 6.1, 9.6, 10.1, 0.3, 11.3, 12.9, 10.1, 14.5, 9.3, 7.0, 12.3, 12.6, 8.2, 11.8, 12.1, 21.8, 22.3, 20.5, 26.2, 24.1, 23.3, 23.2, 23.0, 23.1, 20.4, 24.4, -56.0};
Double_t std1[28] = {89.1, 89.7, 89.6, 89.4, 90.3, 91.6, 90.1, 90.3, 89.1, 90.3, 90.5, 90.1, 91.0, 91.5, 91.3, 91.1, 91.0, 90.8, 90.9, 90.5, 91.0, 91.7, 91.5, 91.4, 91.9, 93.2, 91.4, 452.8};
auto* legend = new TLegend(0.15, 0.77, .4, .87);
legend->SetNColumns(2);
auto graph0 = new TGraphErrors(28, biasVoltage, mean0, errors_voltage, std0);
auto graph1 = new TGraphErrors(28, biasVoltage, mean1, errors_voltage, std1);
legend->AddEntry(graph0, "Chip 0");
legend->AddEntry(graph1, "Chip 1");
graph0->SetFillColor(1);
graph0->SetMarkerColor(1);
graph0->SetMarkerStyle(20);
graph0->SetFillStyle(3004);
graph1->SetFillColor(2);
graph1->SetMarkerColor(2);
graph1->SetMarkerStyle(20);
graph1->SetFillStyle(3005);
TMultiGraph *mg = new TMultiGraph();
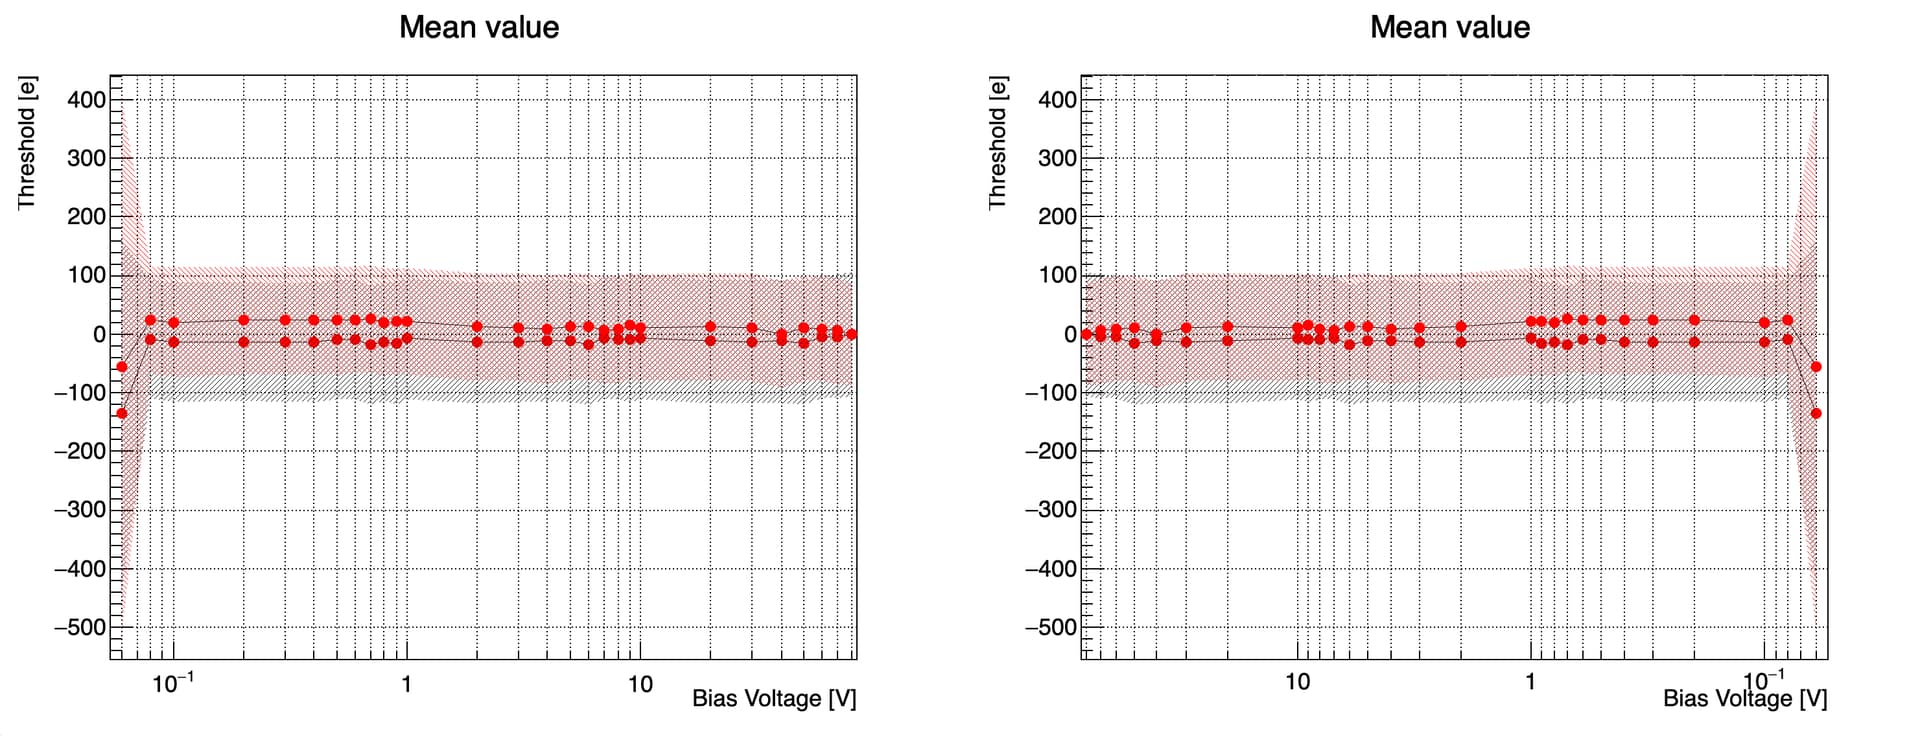
mg->SetTitle("Mean value ;Bias Voltage [V];Threshold [e]");
mg->Add(graph0);
mg->Add(graph1);
TCanvas *canvas = new TCanvas("c", "c", 200,10,900,600);
canvas->cd();
gPad->SetLogx();
//mg->GetXaxis()->LabelsOption(">");
mg->Draw("a3 p"); //option "Rx"
legend->Draw("same");
}