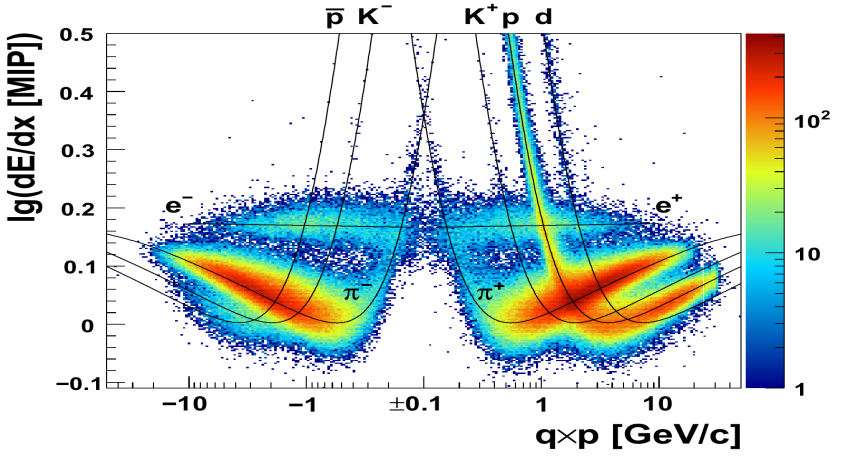
I’m looking for suggestions on how to make a custom axis which would allow for setting a logarithmic scale on negative values. I would like to achieve something similar to this plot:
Your picture does not show any log(negative number). For the y-axis, when dE/dx = 0.794 then log10(dE/dx) = -0.1 and when dE/dx = 0.905 then log(dE/dx) = -0.1 and when dE/dx = 1 then log10(dE/dx) = log(dE/dx) = 0 (I don’t know what they mean by “lg”).
Oh, sorry… My question wasn’t clear enough - I’m interested in what was done with horizontal axis. There is nothing interesting going on with the vertical one, but the label is indeed misleading.
I don’t know where you’ve got this plot from but, try to directly contact its authors (they may give you the script which creates it). It seems that it’s a plot from the “NA61 / SHINE experiment at CERN SPS”, showing the “energy deposit in TPCs” for the “p+C at 31 GeV/c (2007 data)”.
Thank you for your replies.
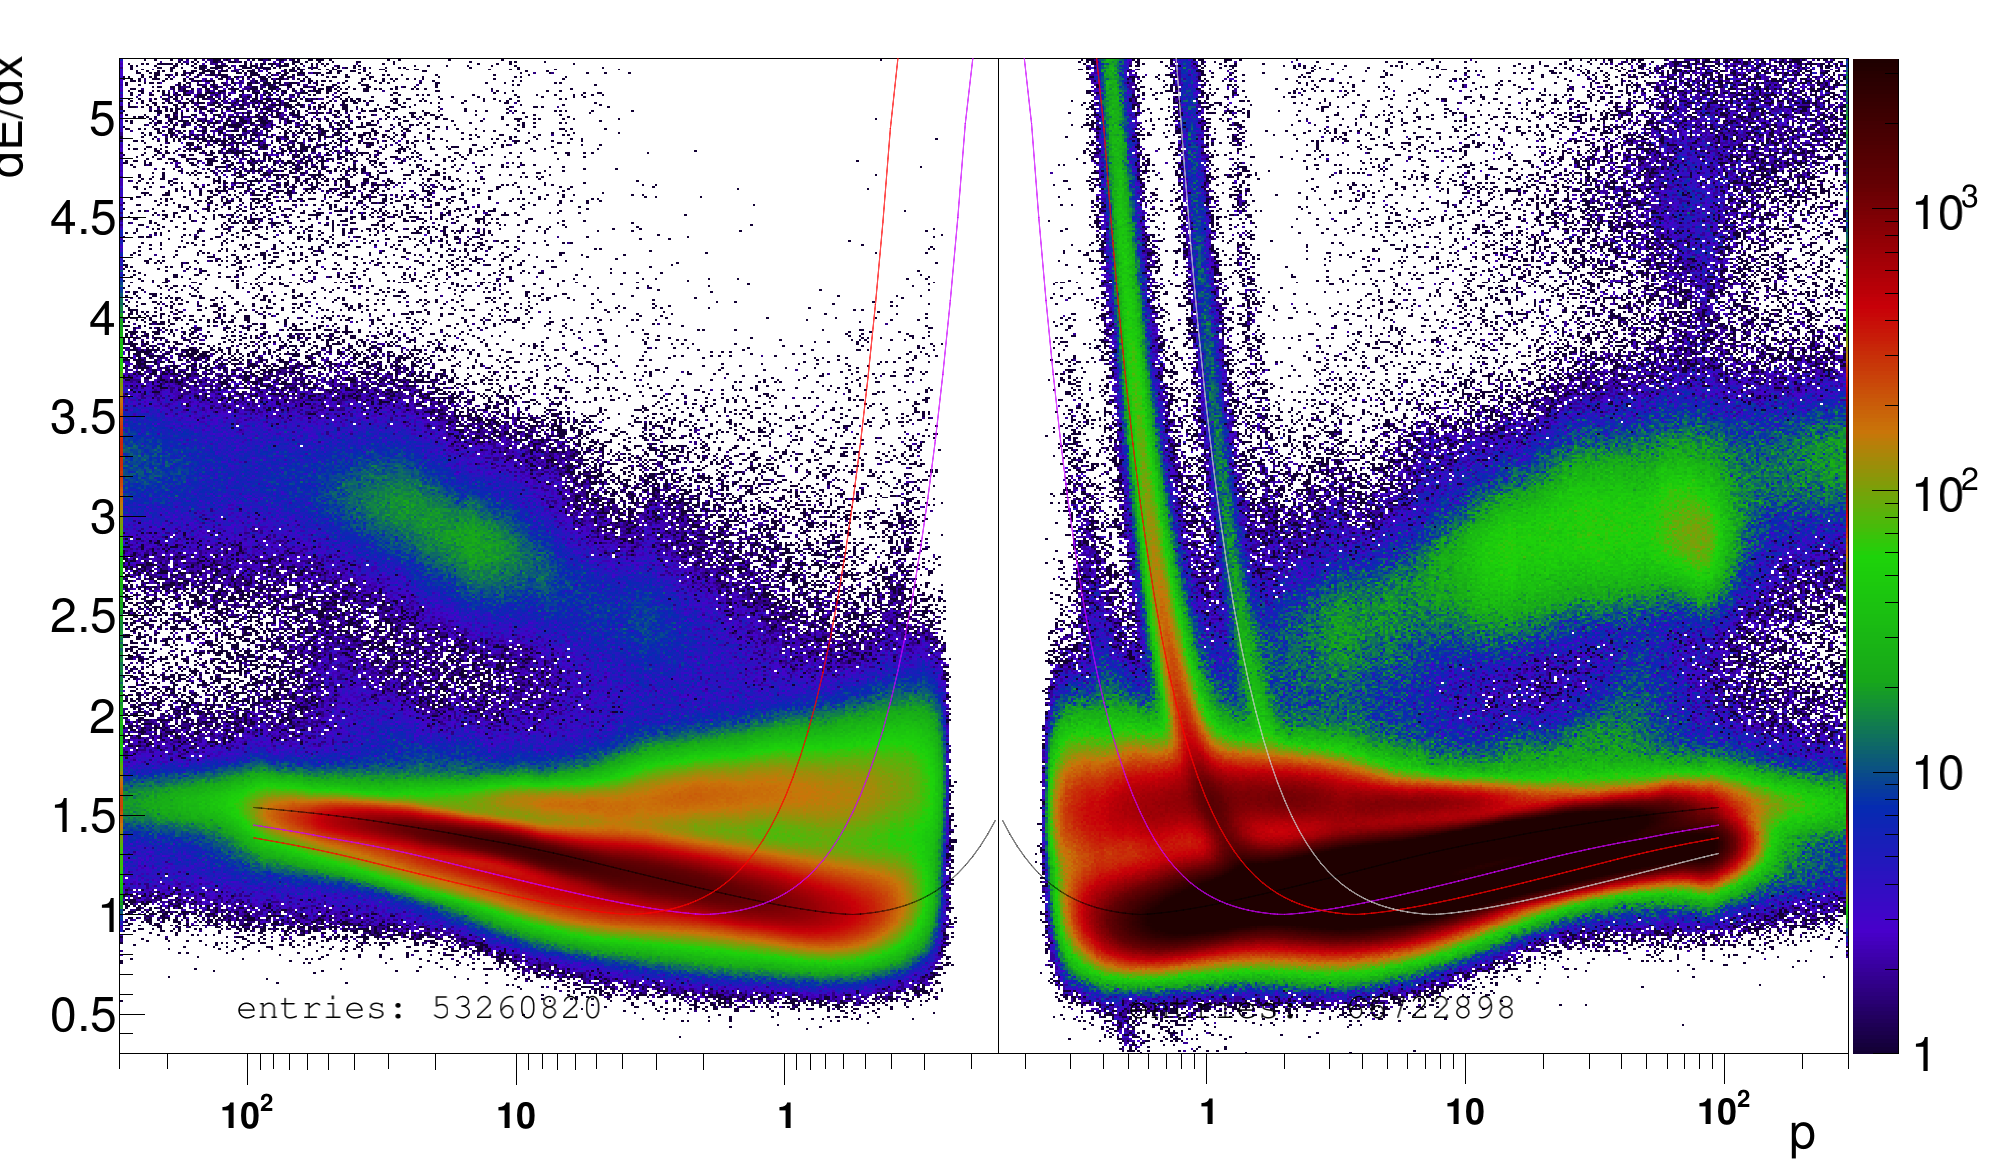
In case anyone is interested I use such a trick, that I plot my data with -log(p) as x-axis and then I just remove original axis and I draw a new one, which is reversed. There is no minus sign though.
[...]
double xlow = -TMath::Log10(300.);
double xup = -TMath::Log10(0.1);
TH2F* hist_neg = new TH2F("hneg","hneg",nbinsx,xlow,xup,nbinsy,ylow,yup);
// in a for loop over my data:
    hist_neg->Fill( -1*TMath::Log10(ptot) , dedx );
[...]

gPad->Update();

dEdx_neg_data->GetXaxis()->SetLabelOffset(999);
dEdx_neg_data->GetXaxis()->SetTickLength(0);

TGaxis *newaxis = new TGaxis(
                                gPad->GetUxmax(),
                                gPad->GetUymin(),
                                gPad->GetUxmin(),
                                gPad->GetUymin(),
                                0.1,
                                300.,
                                510,"G+");
newaxis->SetLabelOffset(-0.11);
newaxis->Draw();