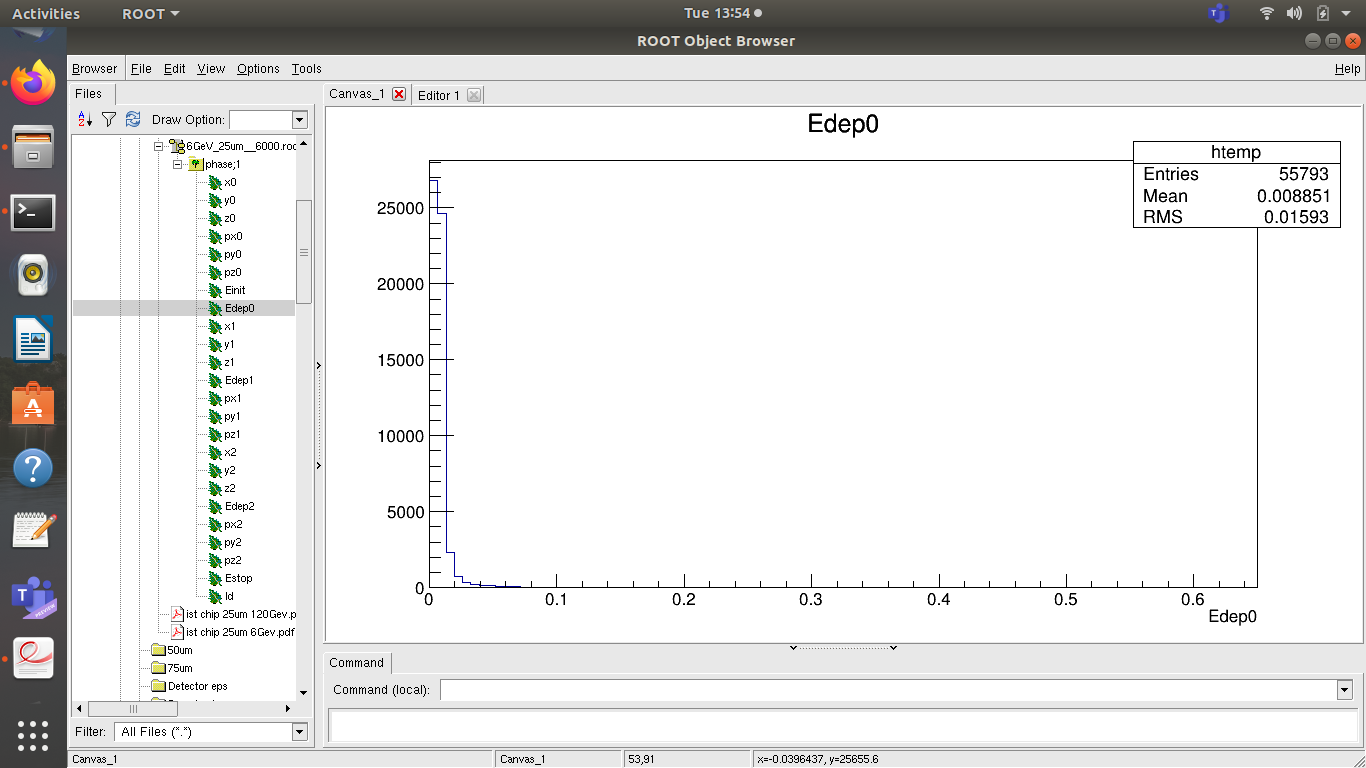
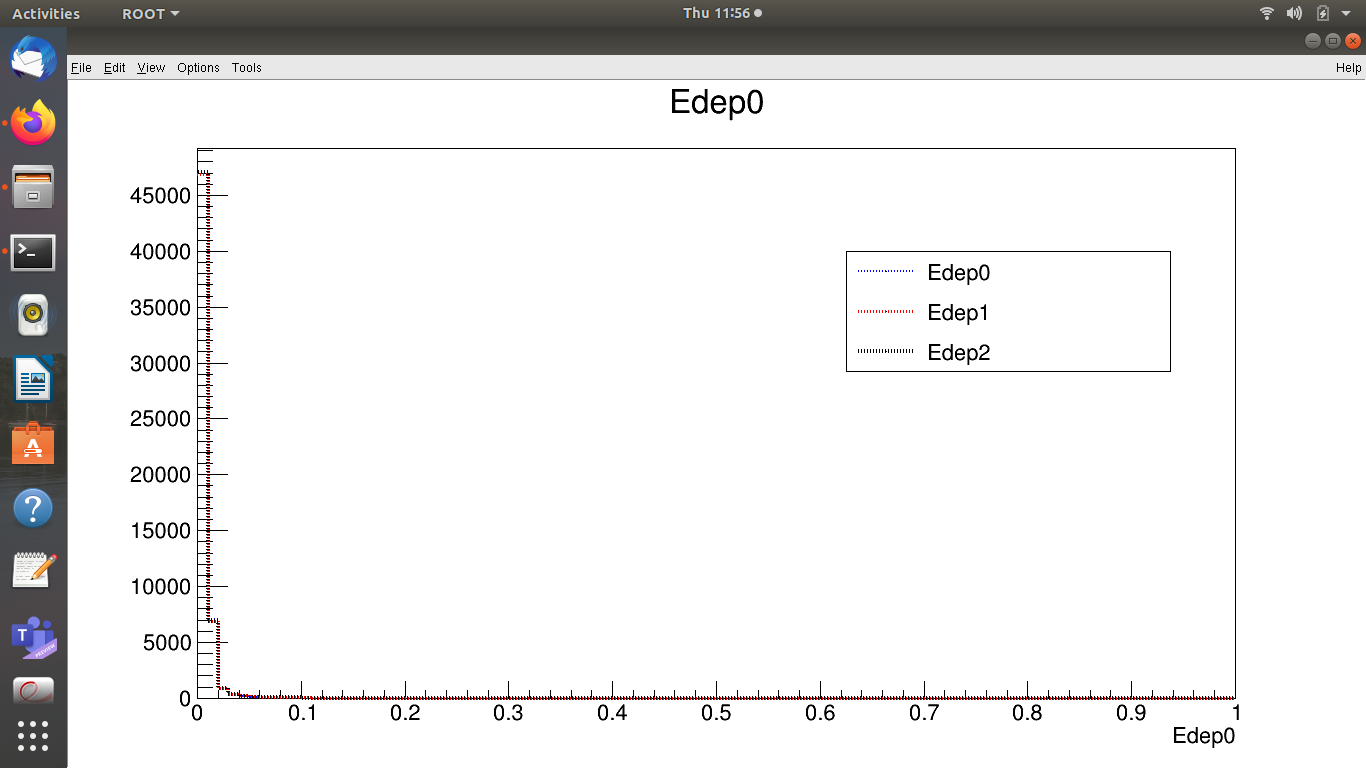
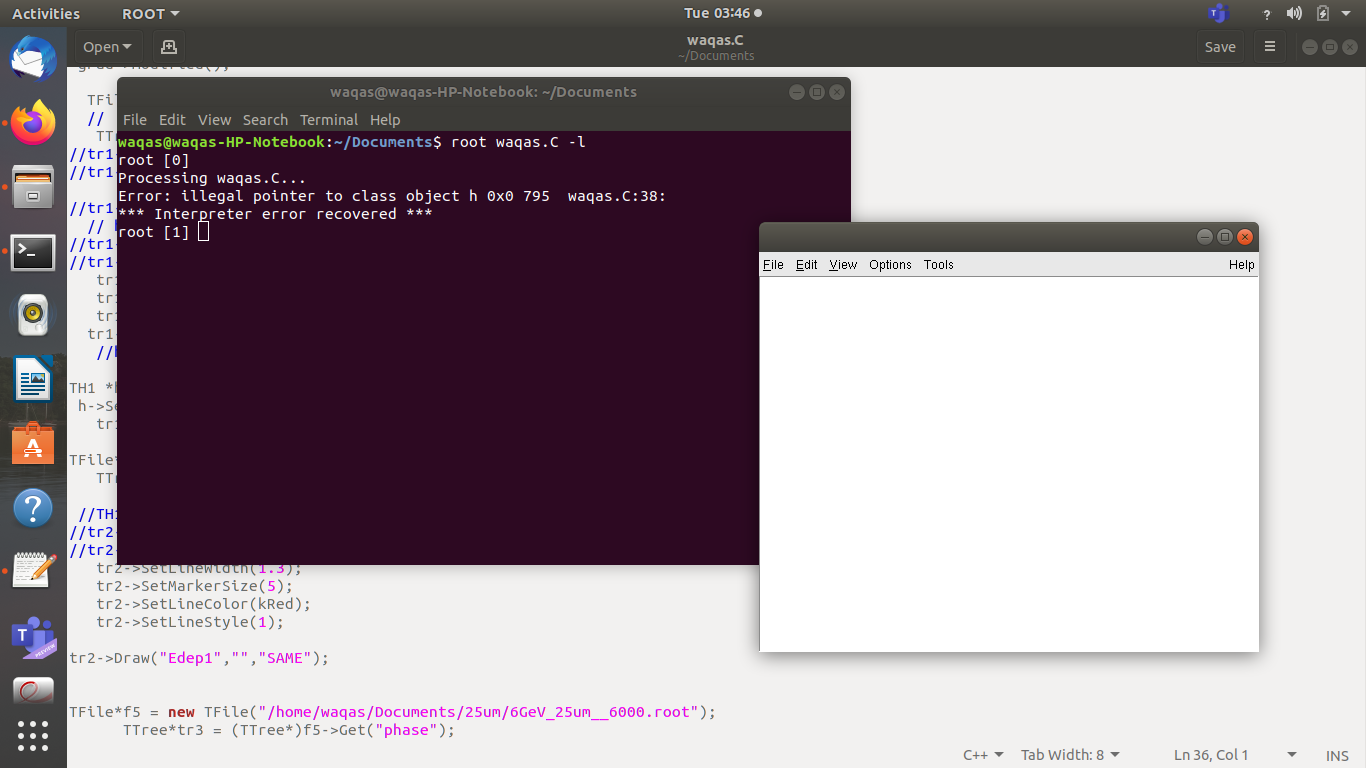
i need help for creating three Edep0 Edep1 Edep2 in one canvas , but it gives blank image , help me for it
#include "TFile.h"
#include "TF1.h"
#include "TH1.h"
#include "iostream.h"
void waqas()
{

   gStyle->SetOptStat(0);

   gROOT->Reset();
   TCanvas *c1 = new TCanvas("c1","",0,0,500,400);
   //c1->Divide(3,1);

  {
//c1->cd(1);

//gPad->SetLogy();
//gPad->SetLogx();
 //gPad->Modified();

  TFile *f1 = new TFile("/home/waqas/Documents/25um/6GeV_25um__6000.root");
  //  TTree *tree = (TTree*)f1->Get("Edep0/phase/");
   TTree *tr=(TTree*)f1->Get("phase");
   TLeaf *l1=(TLeaf*)tr->GetLeaf("Edep0");
  // TH1F *TTree= (TH1F*)f1->Get("phase/Edep0");
//h1->GetXaxis()->SetTitle("P_{T}(GeV/c)");
//h1->RebinAxis(150, h1->GetXaxis());
   l1->SetLineWidth(2);
   l1->SetMarkerSize(5);
   l1->SetLineColor(kBlue);
  l1->SetLineStyle(3);*/
   //h1.Scale(2);

   l1->Draw("");
/*
TFile*f2 = new TFile("/ho me/waqas/Documents/25um/6GeV_25um__6000.root");
 TH1F*h2 = (TH1F*)f2->Get("phase/Edep1");
//h1->GetXaxis()->SetTitle("P_{T}(GeV/c)");
//h2->RebinAxis(100, h2->GetXaxis());
   h2->SetLineWidth(2);
   h2->SetMarkerSize(5);
   h2->SetLineColor(kRed);
   h2->SetLineStyle(3);

   h2->Draw("Hist SAME");

TFile*f5 = new TFile("/home/waqas/Documents/25um/6GeV_25um__6000.root");
      TH1F*h5 = (TH1F*)f5->Get("phase/Edep2");
//h1->GetXaxis()->SetTitle("P_{T}(GeV/c)");
//h2->RebinAxis(100, h2->GetXaxis());
   h5->SetLineWidth(2);
  h5->SetMarkerSize(5);
   h5->SetLineColor(kBlack);
  h5->SetLineStyle(3);

   h5->Draw("Hist SAME"); */