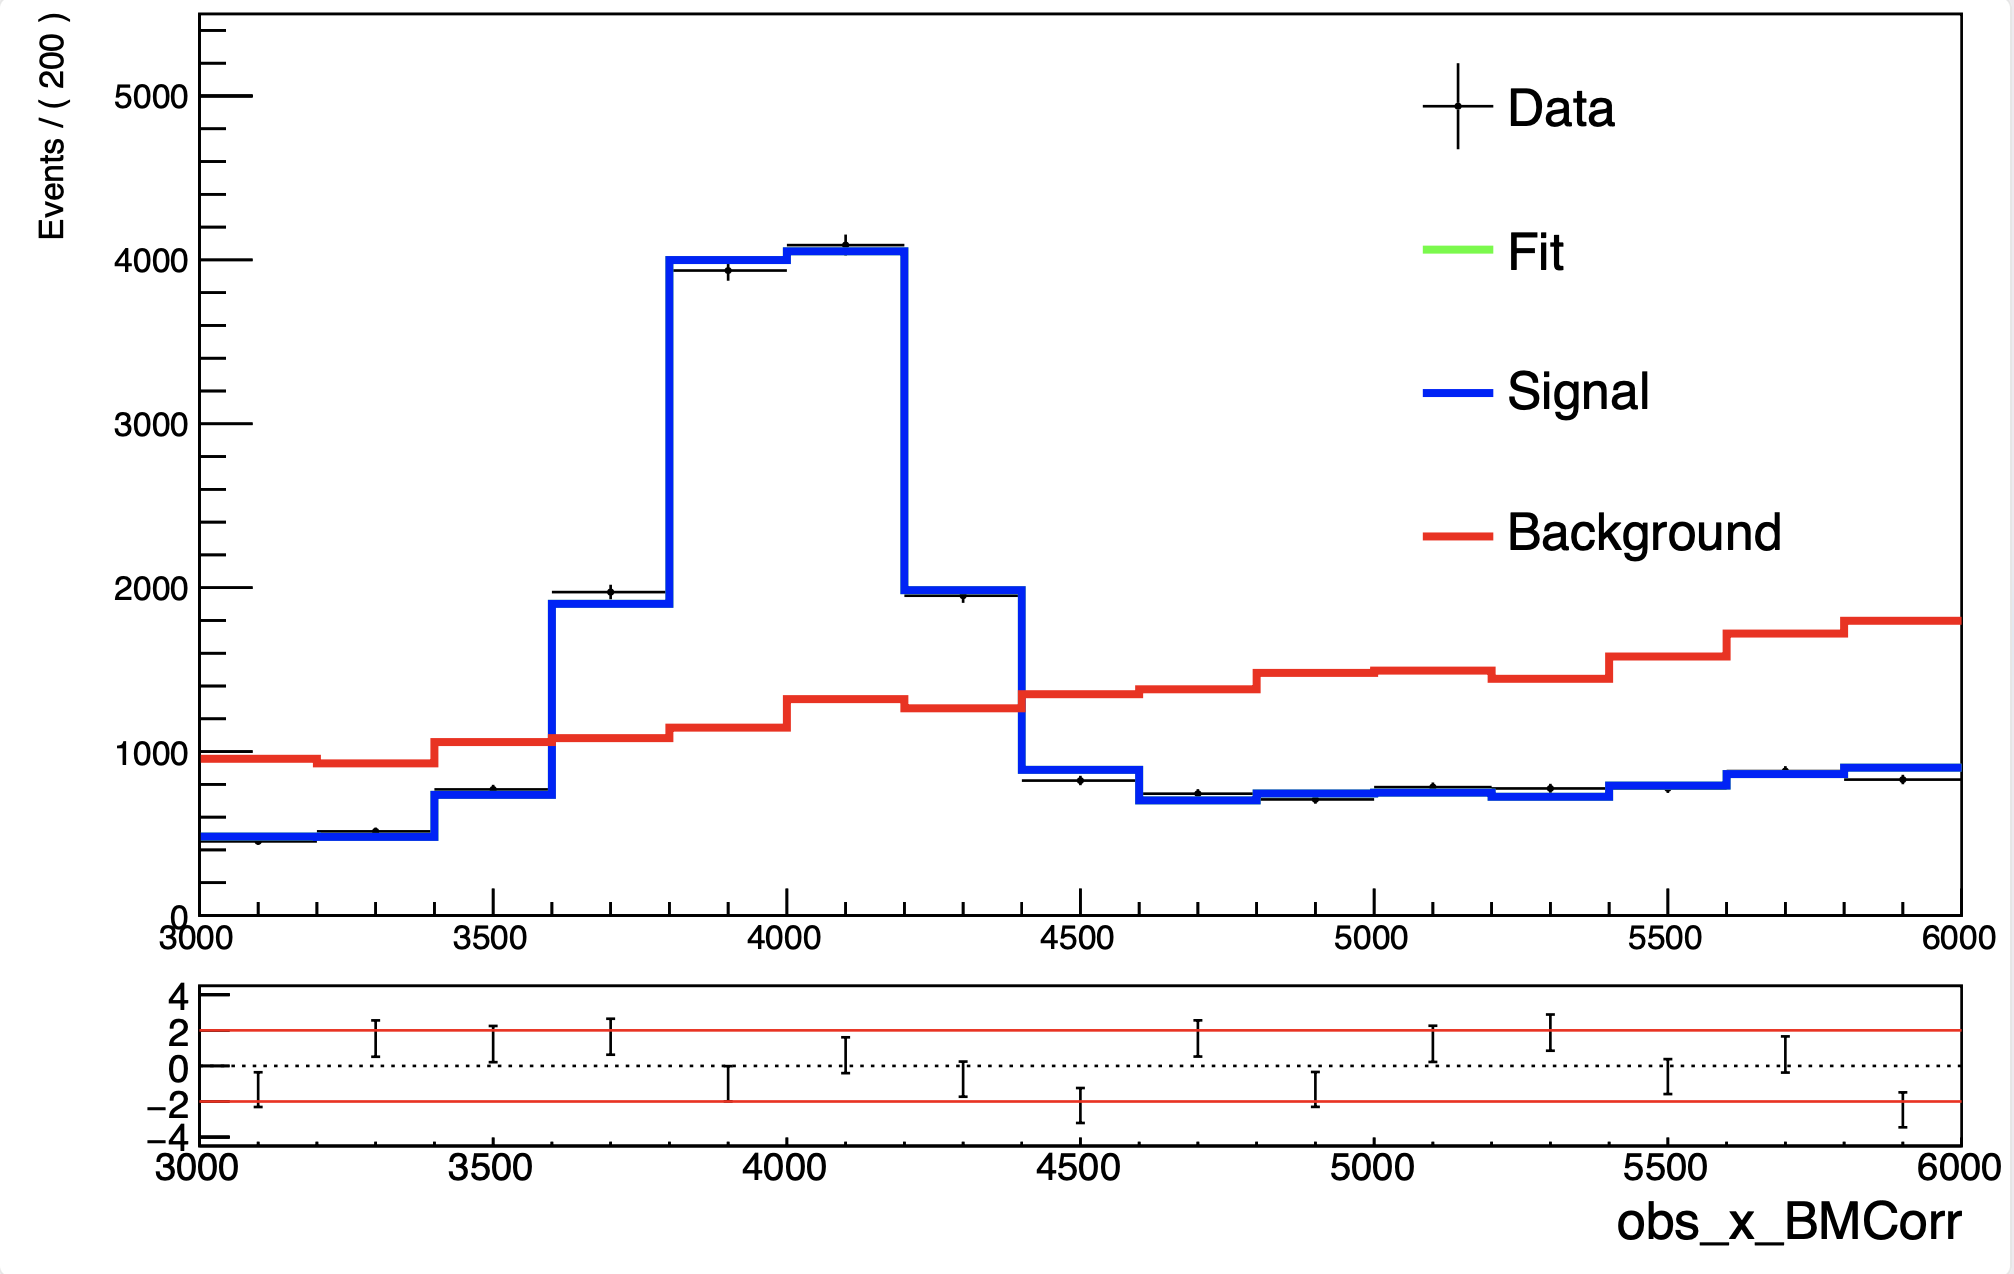
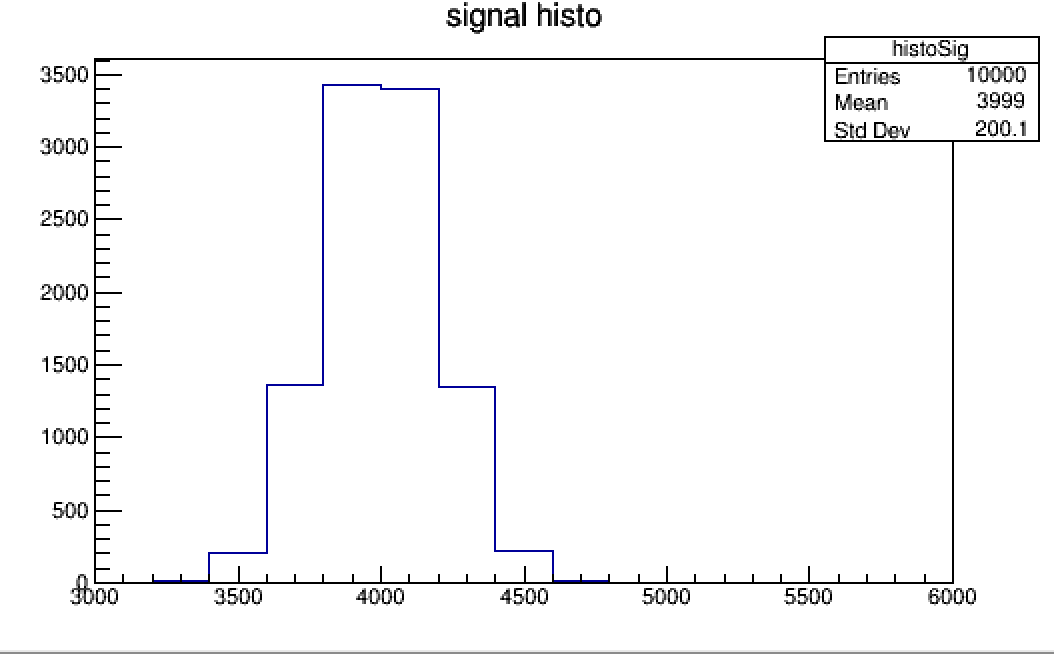
I am using histFactory with ROOT 6.28 to perform a simple 1D fit with one signal and one background histogram. However, when I try to plot the fit result, the signal (blue) and the total pdf (green) are completely overlapping as you can see in the attached plot “obs_x_BMCORR”. However, the shape of the signal histogram is different from the total pdf as you can see in the attached plot “signal_histogram”. In addition to this, the normalisation of the background is not correct, i.e. it seems like it is normalised to the sum of all events.
The code that I use to generate the histograms and perform the fit is attached as “toyModel_simple.C.txt” (or maybe it is showed here as “text.txt”).
Do anyone know why this happens and how it can be solved?
In fact, there were two separate bugs leading to this problem, and this PR that I will merge tomorrow to ROOT master will fix both:
Unfortunately, there is no easy workaround, and your options are to either wait for the next ROOT release 6.30 in a few weeks, building ROOT master from source, or use the ROOT nightly once the patch has landed in the nightlies:
Sorry again it took so long to fix this. It was quite an intricate problem.
Thank you so much for fixing these bugs. I just ran the ‘toyModel_simple.C’ script (a slightly modified version that uses ‘RooMinimizer’ instead of 'RooMinuit) with the latest ROOT nightly, and now the plotting seems to work, so that is super nice. Again, thanks a lot!
There seems to be a significant difference in the result of my 2D fit between the most recent root release (6.28/06) and the root version that you fixed, which I run via the nightlies (ROOT 6.29/01). I only observe this inconsistency when the fit is performed in 2D (not in 1D) when the Beeston-Barlow (BB) method is activated (without BB the result in 2D also agrees between the two ROOT versions).
I have attached the script (“toyModel_1D_and_2D_wBB.C”) that I use to run the toy fit. It can be used to perform both a 1D and 2D fit with/without BB. More details of how to run the code can be found in the top of the script.
The final signal and background yields and, in particular, their uncertainties are different between the two ROOT versions. Furthermore, the table with constant parameters look very different. With ROOT 6.28/06 the gamma parameters in all the bins are minimised to some value different from one, however, with ROOT 6.29/01 many of these parameters are set to one because sigma is found to be zero and for the rest of the parameters the values do not agree between the two versions.
I have attached two text files with the printed output (including the fit result tables) (“printed_output_ROOT_v6_28_06.txt” and “printed_output_ROOT_v6_29_01.txt”).
Do you have some idea of what could be causing this difference?
We have done some more investigations and we can see that the list of constant parameters are changing between the latest ROOT release and ROOT nightlies.
In general, it’s better to open new threads for follow-up questions once the original question is solved, because then the post is not on our radar anymore. So it’s good that you did this!