I draw a histogram and i zoom it by resizing its range then it is showing discreteness and i want to have a continuation so that when i fit each peak in histogram my fit and histogram peak should coincide each other.
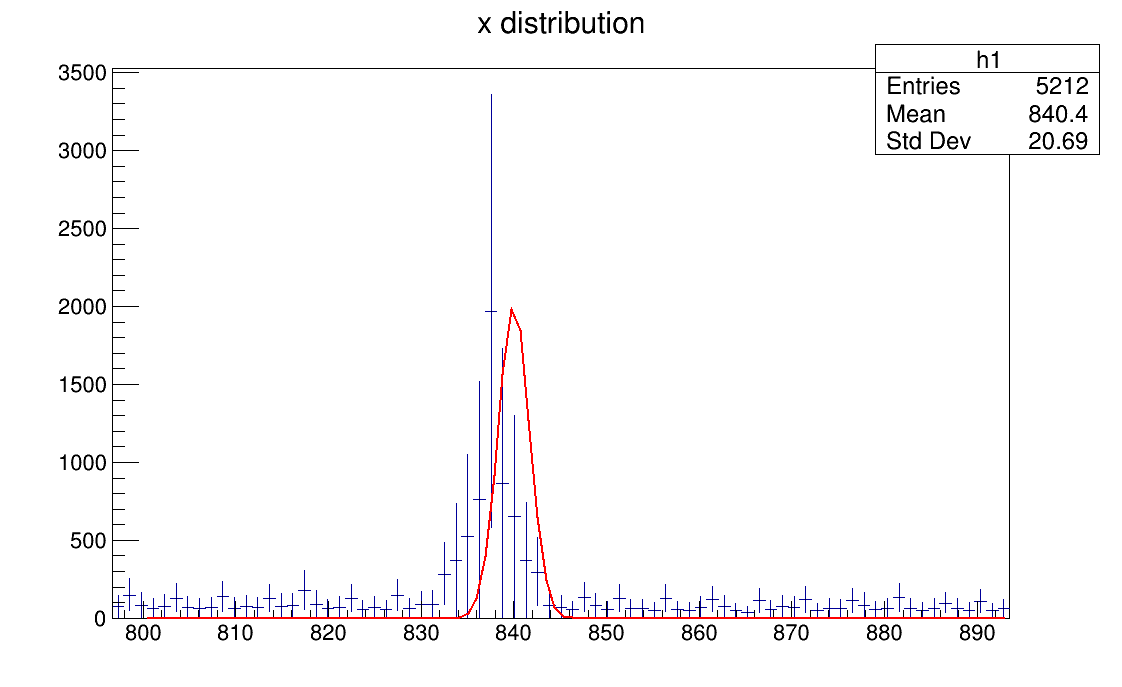
This curve is showing one of the peaks in my histogram. The blue color lines is showing the original data and i want to have continuous peak instead of discrete one. Is it possible to make it continuous so that i can fit it precisely?
Hi
the way your data are represented in a plot: either with error bars as shown or with
option HIST as a continuous line has n o t h i n g to do with how a fit is done.
From point of view how to present and compare data and the fit the method
with error bars is much more useful and normally used.
As Otto said it is much better to keep the error bars. But if you insist to have your histogram drawn as a continuous line you can use option HIST (as Wile said) combined with L. So, the option: "HIST L"
No it is not a real. it is just showing the function in the range provided by me.
I know this is not exactly fitting. Please explain what should i change in my program so that it will take parameters by its own.
Code is given below: hist.C (1.7 KB)
The data is inside the .dat file and it is taking data from .dat file.
In order to fit data, instead of only drawing the function i am writing the fit command.
Please look at the file again. hist.C (1.7 KB)
In the terminal, root is showing the value of parameters as:
Processing hist.C…
Info in TCanvas::MakeDefCanvas: created default TCanvas with name c1
x=128.000000, y=1.000000x=140.000000, y=1.000000x=141.000000, y=3.000000x=142.000000, y=2.000000x=143.000000, y=1.000000 FCN=18.031 FROM MIGRAD STATUS=CONVERGED 374 CALLS 375 TOTAL
EDM=1.37554e-06 STRATEGY= 1 ERROR MATRIX ACCURATE
EXT PARAMETER STEP FIRST
NO. NAME VALUE ERROR SIZE DERIVATIVE
1 Constant 5.56951e+01 2.82397e+01 1.68757e-02 7.43789e-05
2 Mean 1.13756e+03 1.30089e+02 2.75985e-02 9.02605e-05
3 Sigma 6.32970e+01 6.02003e+01 9.36054e-04 2.71007e-03
found 5212points
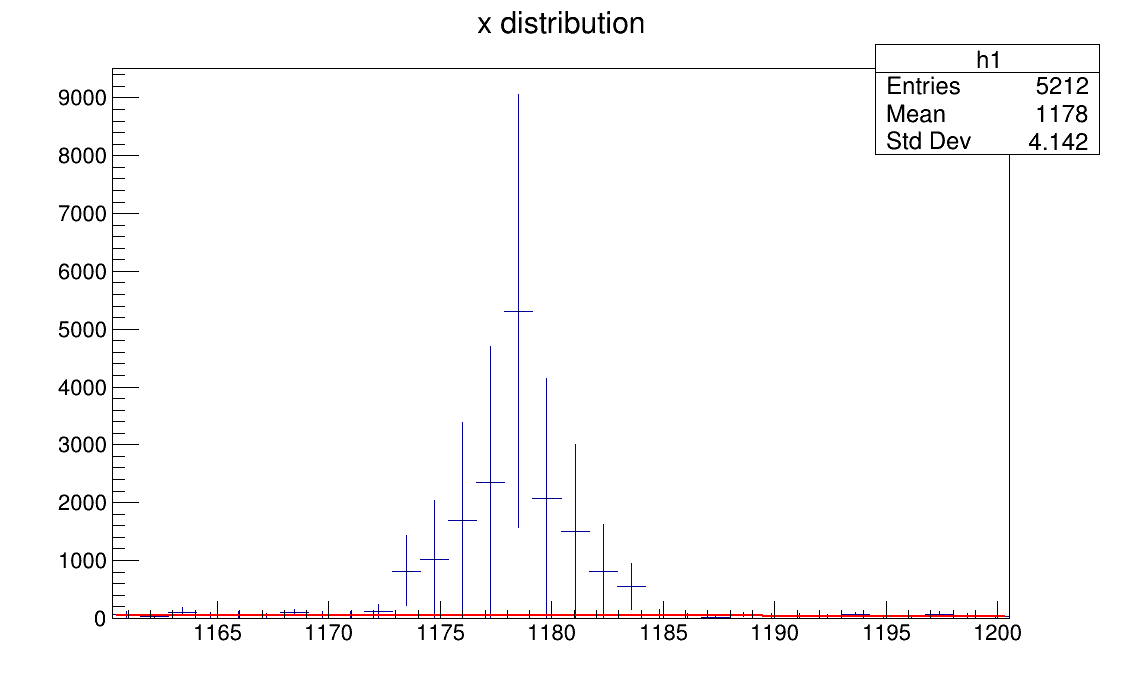
Now, look what the canvas is showing for the 3rd peak
$ root hist.C
   ------------------------------------------------------------------
  | Welcome to ROOT 6.21/01                        https://root.cern |
  | (c) 1995-2019, The ROOT Team; conception: R. Brun, F. Rademakers |
  | Built for macosx64 on Mar 05 2020, 07:46:07                      |
  | From heads/master@v6-19-01-3251-g9f06169855                      |
  | Try '.help', '.demo', '.license', '.credits', '.quit'/'.q'       |
   ------------------------------------------------------------------

root [0]
Processing hist.C...
Warning in <Fit>: Fit data is empty
found 0points
root [1]
eu_gu_1.C (44.1 KB)
In this portal .dat file is not uploaded. That’s why i changed the name of eu_gu_1.dat file as eu_gu_1.C
So you just convert into .dat file and run the program.
Thanks for help.
I have got so much information from this example.
Added to the above problem, could you please help me in calculating the total number of peaks drawn in the spectrum.