The first parameter of “gaus” is the “peak’s height” while the first parameter of “gausn” is the “peak’s area”.
In both cases, the second parameter is the “peak’s mean” (i.e. the “peak’s position”).
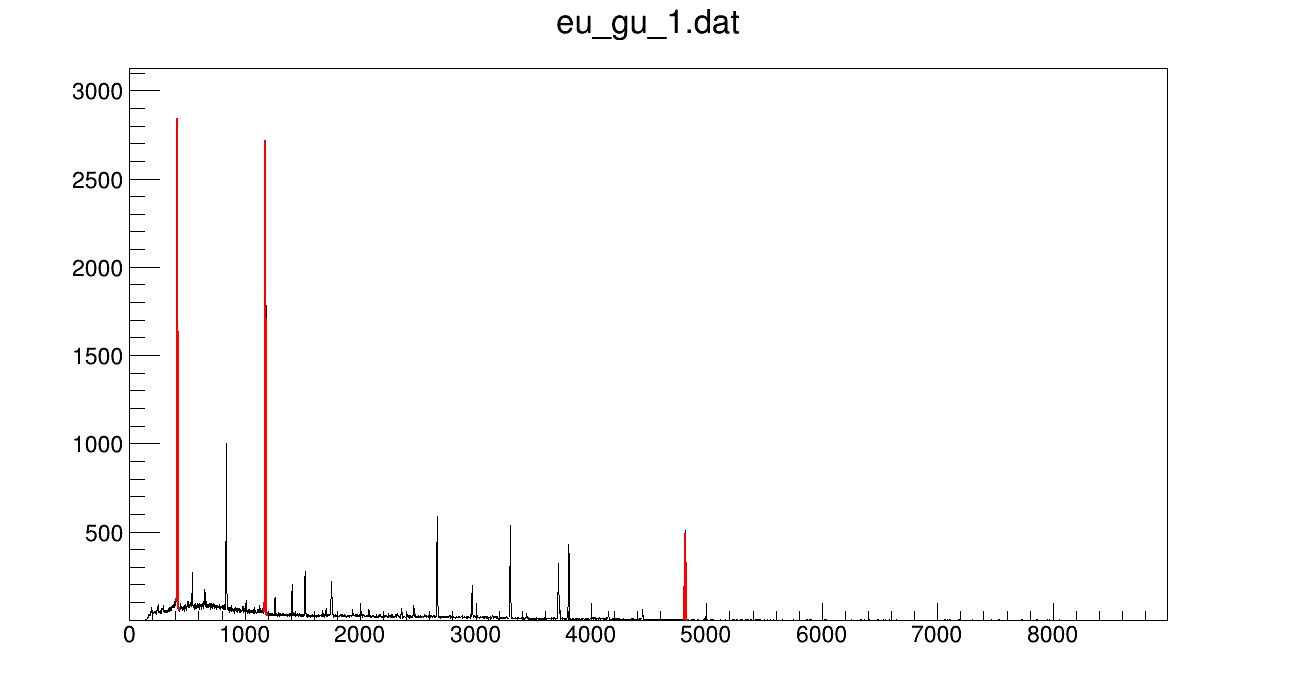
{
TGraph *g = new TGraph("eu_gu_1.dat");
// g->Sort(); // just a precaution
TF1 *f1 = new TF1("f1", "gausn(0) + pol1(3)", 400., 435.); // linear background
f1->SetParameters(14000., 415., 2., 0., 0.);
g->Fit("f1", "BR+");
TF1 *f2 = new TF1("f2", "gausn(0) + pol1(3)", 1160., 1200.);
f2->SetParameters(15000., 1178., 2., 0., 0.);
g->Fit("f2", "BR+");
TF1 *f3 = new TF1("f3", "gausn", 4795., 4835.); // clean peak, no background
f3->SetParameters(4400., 4815., 3.);
g->Fit("f3", "BR+");
g->Draw("AL");
}
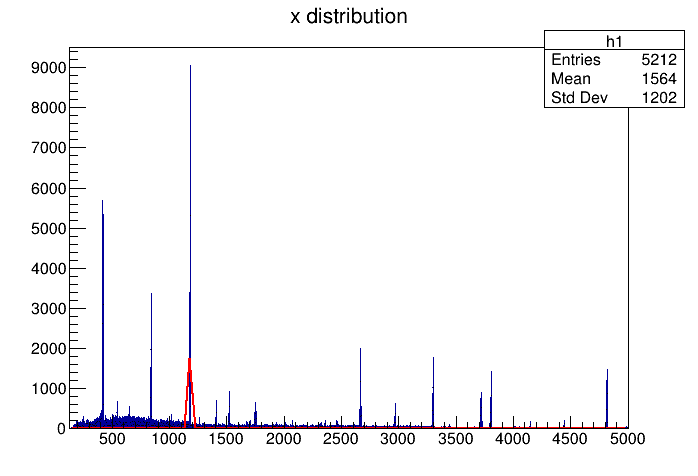
{
TGraph *g = new TGraph("eu_gu_1.dat");
// g->Sort(); // just a precaution
  Int_t n = g->GetN();
  Double_t *x = new Double_t[(n + 1)];
  x[0] = (3.0 * g->GetX()[0] - g->GetX()[1]) / 2.0;
  x[n] = (3.0 * g->GetX()[(n - 1)] - g->GetX()[(n - 2)]) / 2.0;
  for (Int_t i = 1; i < n; i++)
    { x[i] = (g->GetX()[(i - 1)] + g->GetX()[i]) / 2.0; }
  TH1D *h = new TH1D("h", "spectrum;x-value;#counts", n, x);
  h->FillN(n, g->GetX(), g->GetY());
  h->Sumw2(kFALSE); // restore proper errors
  delete [] x; // no longer needed
  delete g; // no longer needed
TF1 *f1 = new TF1("f1", "gausn(0) + pol1(3)", 400., 435.); // linear background
f1->SetParameters(14000., 415., 2., 0., 0.);
h->Fit("f1", "BR+"); // e.g. "BR+" or "LBR+"
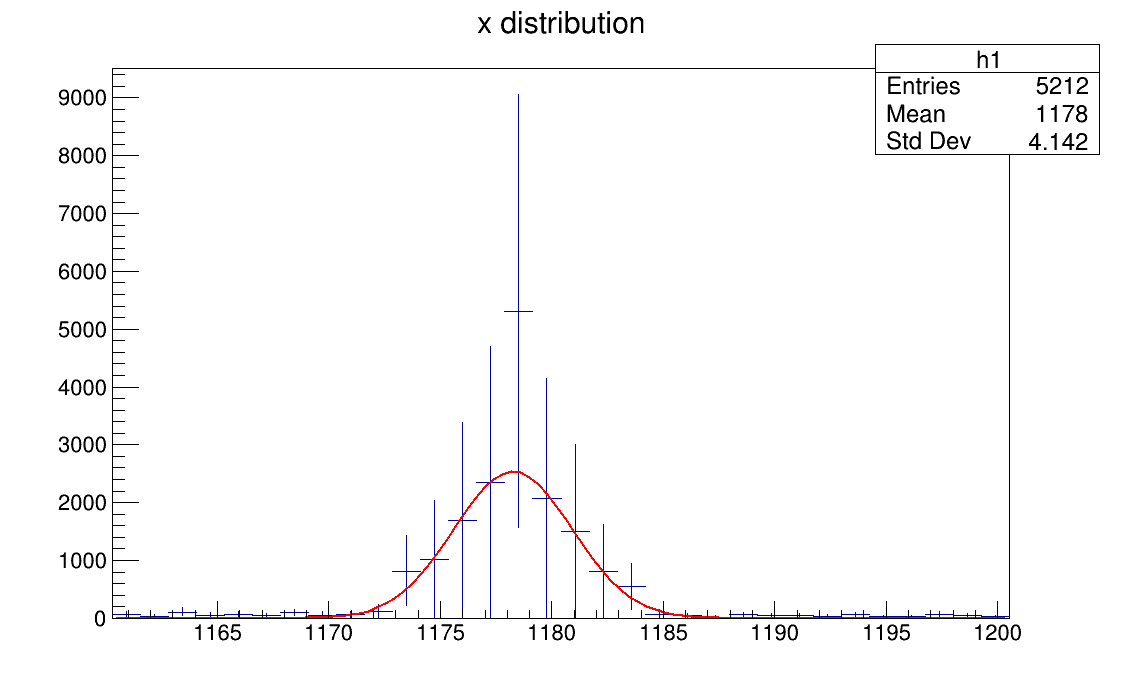
TF1 *f2 = new TF1("f2", "gausn(0) + pol1(3)", 1160., 1200.);
f2->SetParameters(15000., 1178., 2., 0., 0.);
h->Fit("f2", "BR+"); // e.g. "BR+" or "LBR+"
TF1 *f3 = new TF1("f3", "gausn", 4795., 4835.); // clean peak, no background
f3->SetParameters(4400., 4815., 3.);
h->Fit("f3", "BR+"); // e.g. "BR+" or "LBR+"
}