Dear all,
I am trying to extend the 1D model I posted here:
to a 2D model.
The model is built from TH2F histograms with different number of bins for the two variables. I have a weird behabiour when plotting the distributions of the variables: the model does not match with both the initial parameter values before fitting and with the fitted parameters after performing the fit:
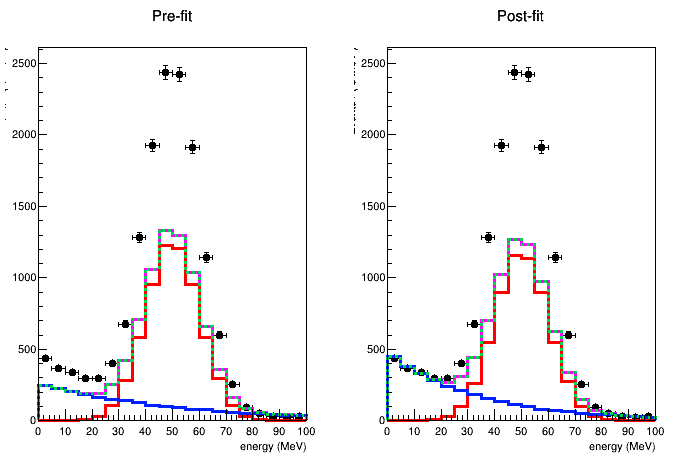
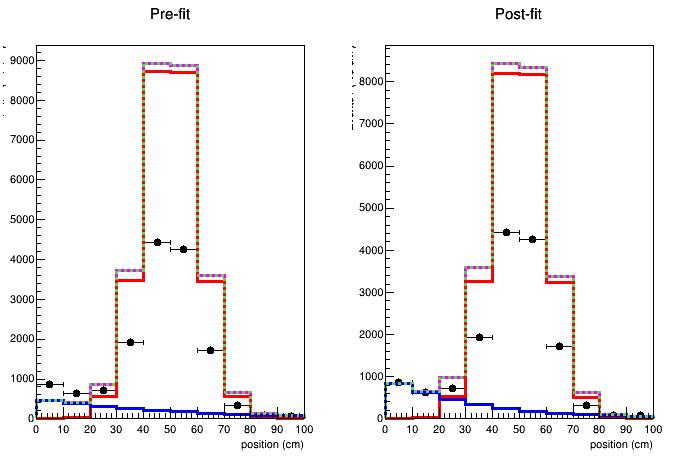
It seems just a problem related to the plots, because the fit is able to find the actual vaues of the parameters.
The behaviour is the expected one if the number of bins is the same for both variables.
Here is the macro:
void test_morph()
{
	// signal
	TH2F* hsgn = new TH2F("hsgn","nominal bkg", 20, 0, 100, 10, 0, 100);
	TF2* g = new TF2("g","[0]*exp(-(x-[1])^2/(2*[2]^2))*exp(-(y-[1])^2/(2*[2]^2))", 0, 100, 0, 100);
	g -> SetParameters(100, 50, 10);
	hsgn -> FillRandom("g", 100000);

	// background
	TH2F* hbkg_nom = new TH2F("hbkg_nom","nominal bkg", 20, 0, 100, 10, 0, 100);
	TF2* fe = new TF2("fe","[0]*exp(-[1]*(x+y))", 0, 100, 0, 100);
	fe -> SetParameters(50, 0.02);
	hbkg_nom -> FillRandom("fe", 80000);

	TH2F* hbkg_p = new TH2F("hbkg_p","+1 sigma bkg", 20, 0, 100, 10, 0, 100);
	fe -> SetParameters(55, 0.03);
	hbkg_p -> FillRandom("fe", 150000);

	TH2F* hbkg_m = new TH2F("hbkg_m","-1 sigma bkg", 20, 0, 100, 10, 0, 100);
	fe -> SetParameters(45, 0.01);
	hbkg_m -> FillRandom("fe", 50000);

	// define observables
	RooRealVar e{"e", "energy", 0, 100, "MeV"};
	RooRealVar x{"x", "position", 0, 100, "cm"};
	e.setBins(Int_t(20));
	x.setBins(Int_t(10));

	// signal pdf
	hsgn -> Scale(1./hsgn -> Integral());
	RooDataHist dh_sgn{"dh_sgn", "dh_sgn", RooArgSet{e,x}, hsgn};
	RooHistFunc sgn("sgn", "sgn", RooArgSet{e,x}, dh_sgn);

	// background pdf
	//
	// nominal value
	hbkg_nom -> Scale(1./hbkg_nom -> Integral());
	RooDataHist dh_bkg_nom{"dh_bkg_nom", "dh_bkg_nom", RooArgSet{e,x}, hbkg_nom};
	RooHistFunc bkg_0("bkg_0", "bkg_0", RooArgSet{e,x}, dh_bkg_nom);
	//
	// bkg +1 sigma
	hbkg_p -> Scale(1./hbkg_p -> Integral());
	RooDataHist dh_bkg_p{"dh_bkg_p", "dh_bkg_p", RooArgSet{e,x}, hbkg_p};
	RooHistFunc bkg_p("bkg_p", "bkg_p", RooArgSet{e,x}, dh_bkg_p);
	//
	// bkg -1 sigma
	hbkg_m -> Scale(1./hbkg_m -> Integral());
	RooDataHist dh_bkg_m{"dh_bkg_m", "dh_bkg_m", RooArgSet{e,x}, hbkg_m};
	RooHistFunc bkg_m("bkg_m", "bkg_m", RooArgSet{e,x}, dh_bkg_m);
	//
	// build interpolation between -1 -> +1 sigma
	RooRealVar alpha{"alpha", "alpha bkg sys", 0, -5, 5};
	PiecewiseInterpolation bkg_sys("bkg_sys", "bkg_sys", bkg_0, bkg_m, bkg_p, alpha);

	// build model
	double f_val = 0.8;
	RooRealVar f{"f", "f", f_val, 0, 1};
	// Can not use RooAddPdf: check https://root-forum.cern.ch/t/roofit-include-shape-systematics/41382
	//RooAddPdf model{"model", "model", RooArgSet{sgn, bkg_sys}, f};
	RooRealSumPdf sb{"sb", "sb", RooArgSet{sgn, bkg_sys}, f};

	// introduce alpha constraint
	RooGaussian gaus_alpha("gaus_alpha", "gaus_alpha", alpha, RooFit::RooConst(0), RooFit::RooConst(1));
	RooProdPdf model{"model", "model", sb, gaus_alpha};

	alpha.setVal(1);
	RooDataHist* data = model.generateBinned(RooArgSet{e,x}, 15000, RooFit::Verbose(1));

	// initial values for par
	f.setVal(f_val+0.05);
	alpha.setVal(0.0);
	//alpha.setConstant(kTRUE);

  // e variable
	auto eframe = e.frame(RooFit::Title("Pre-fit"));

	data->plotOn(eframe);

	model.plotOn(eframe, RooFit::LineColor(6));
	model.plotOn(eframe, RooFit::LineColor(2), RooFit::Components("sgn"));
	model.plotOn(eframe, RooFit::LineColor(4), RooFit::Components("bkg_sys"));
	model.plotOn(eframe, RooFit::LineColor(8), RooFit::LineStyle(kDashed), RooFit::Components("bkg_sys,sgn"));

  // x variable
	auto xframe = x.frame(RooFit::Title("Pre-fit"));

	data->plotOn(xframe);

	model.plotOn(xframe, RooFit::LineColor(6));
	model.plotOn(xframe, RooFit::LineColor(2), RooFit::Components("sgn"));
	model.plotOn(xframe, RooFit::LineColor(4), RooFit::Components("bkg_sys"));
	model.plotOn(xframe, RooFit::LineColor(8), RooFit::LineStyle(kDashed), RooFit::Components("bkg_sys,sgn"));

	// fit
	auto fitres = model.fitTo(*data, RooFit::Constrain(alpha), RooFit::Save());

	fitres->Print();

  // e variable
	auto eframe1 = e.frame(RooFit::Title("Post-fit"));

	data->plotOn(eframe1);

	model.plotOn(eframe1, RooFit::LineColor(6));
	model.plotOn(eframe1, RooFit::LineColor(2), RooFit::Components("sgn"));
	model.plotOn(eframe1, RooFit::Components("bkg_sys"), RooFit::LineColor(4));
	model.plotOn(eframe1, RooFit::LineColor(8), RooFit::LineStyle(kDashed), RooFit::Components("bkg_sys,sgn"));

  // x variable
	auto xframe1 = x.frame(RooFit::Title("Post-fit"));

	data->plotOn(xframe1);

	model.plotOn(xframe1, RooFit::LineColor(6));
	model.plotOn(xframe1, RooFit::LineColor(2), RooFit::Components("sgn"));
	model.plotOn(xframe1, RooFit::LineColor(4), RooFit::Components("bkg_sys"));
	model.plotOn(xframe1, RooFit::LineColor(8), RooFit::LineStyle(kDashed), RooFit::Components("bkg_sys,sgn"));

	TCanvas* c = new TCanvas();
	c->Divide(2,1);

	c->cd(1);
	eframe -> Draw();

	c->cd(2);
	eframe1 -> Draw();

	TCanvas* c1 = new TCanvas();
	c1->Divide(2,1);

	c1->cd(1);
	xframe -> Draw();

	c1->cd(2);
	xframe1 -> Draw();

}
Should I use some settings that I am missing?
Thanks for your help.

